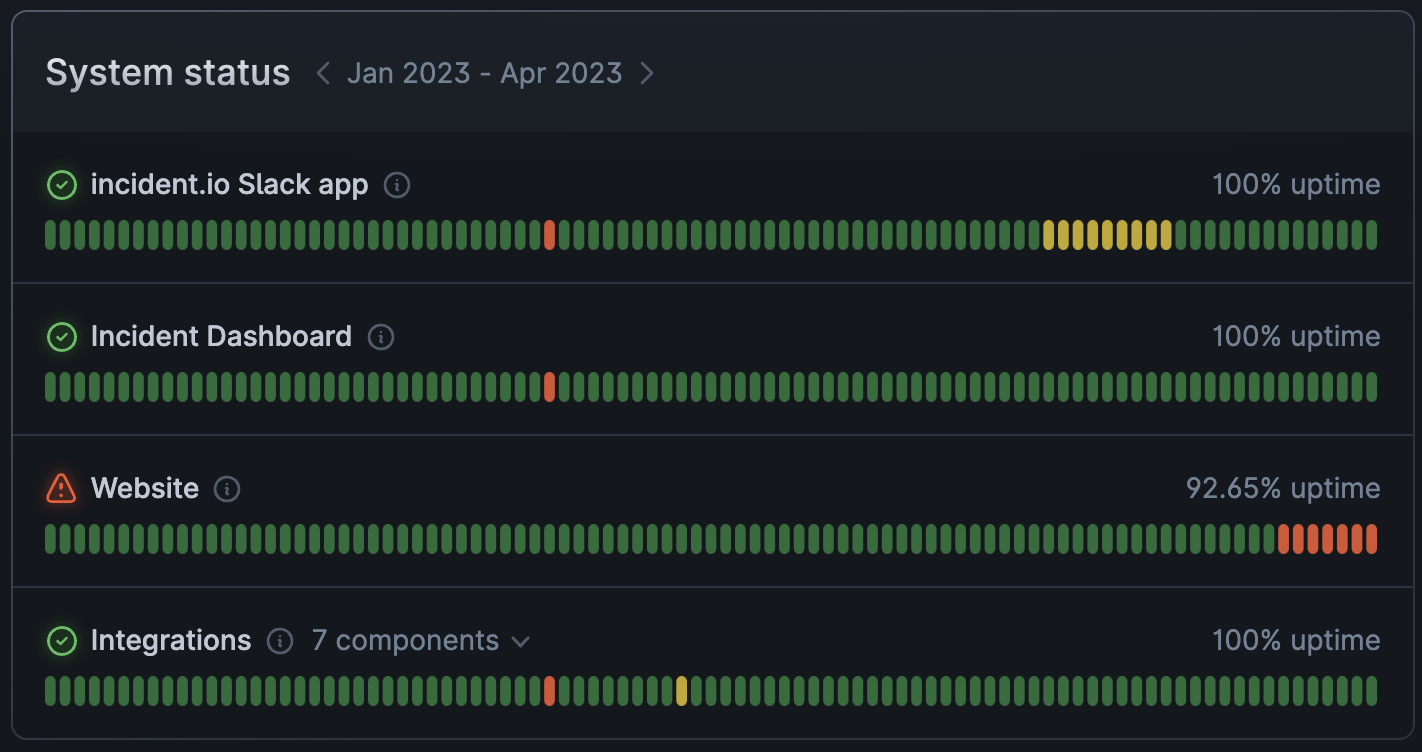
- If an incident is ongoing, we’ll show the icon for the worst current impact
- If an incident is ongoing, but has no impact (for example if impact has been mitigated and you’re now in ‘monitoring’), we’ll show a grey impact icon
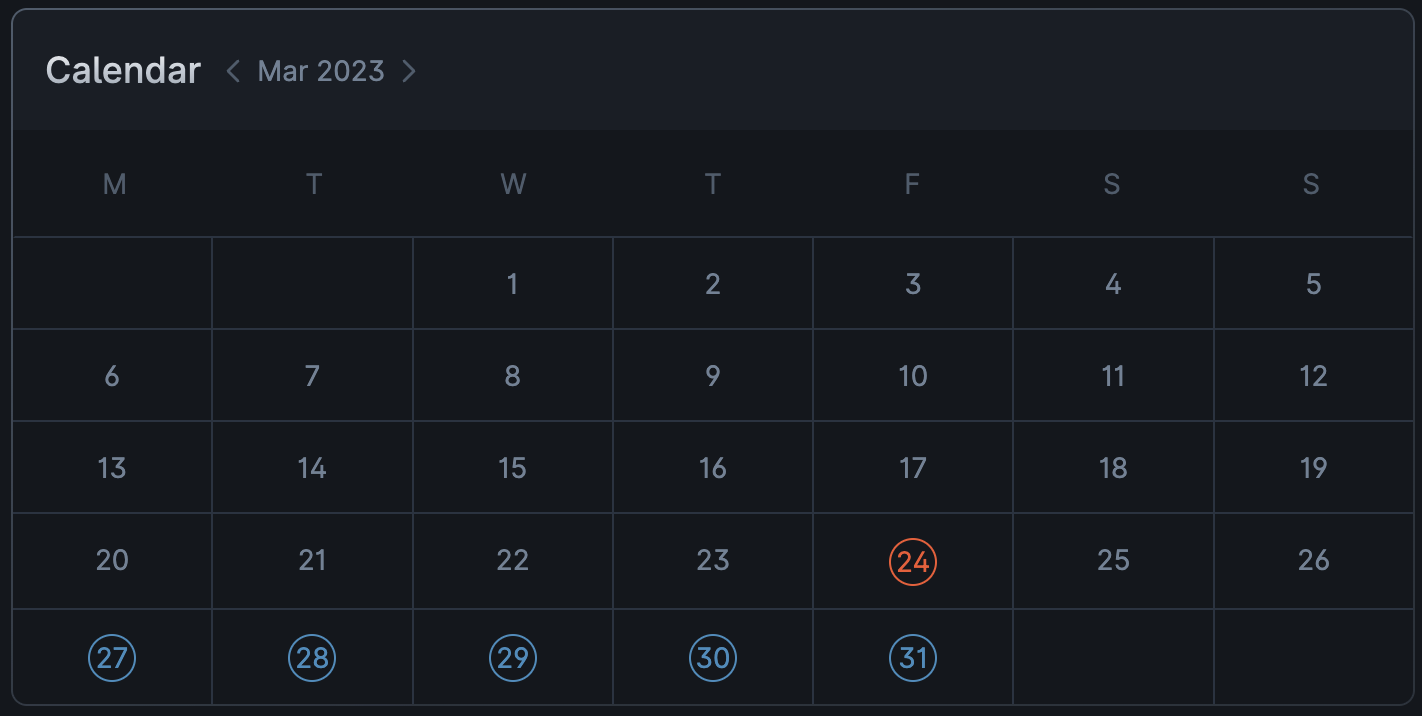
- When an incident is resolved, we show the worst impact it had on each day in the calendar and system status components. For example, if you had a full outage from 11pm until midnight and a partial outage from midnight until 2am, the incident would appear as red on the first day and orange on the second day.
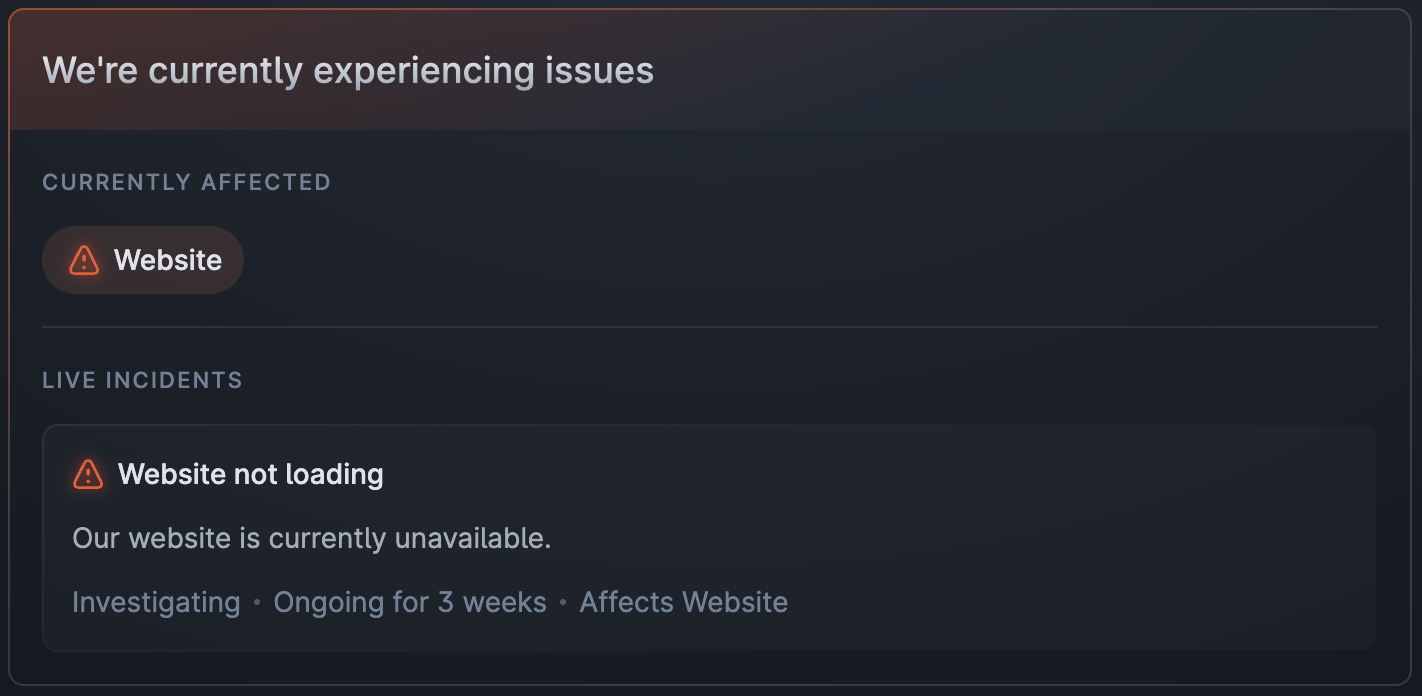
The heads-up banner text (e.g. “We’re currently experiencing issues”) remains visible while any incident is ongoing,
including during the monitoring stage. The banner is automatically removed once the incident is resolved.