

kubectl.
Connect a cluster directly with a kubeconfig, or let Nexus discover clusters from your cloud provider. Connect
AWS for EKS, or Google Cloud for GKE. Every route gives Nexus
the same read-only access to the cluster.
What we support
Nexus reads your cluster the way a responder would withkubectl get and kubectl describe: listing resources and describing a single object in detail. It never writes to the cluster; access is read-only.
- List resources: get a
kubectl get-shaped view of any kind: pods, deployments, statefulsets, daemonsets, jobs, services, ingresses, nodes, events, and the custom resources your operators add. Scope a list to a namespace or a label selector to stay fast on busy clusters. - Describe a resource: get the
kubectl describe-shaped detail for a single object: its spec and status, labels and annotations, the recent events attached to it, and the ownership chain that links a pod back to its replica set and deployment.
Seeing what’s failing
The useful detail in an incident is rarely the healthy workload; it’s the one that isn’t. When Nexus lists pods it sees the same signals you would: the ready container count, the pod phase, and the restart count. When it describes a failing pod it gets its container statuses and the events behind them, so a crash shows up as what it actually is (CrashLoopBackOff, ImagePullBackOff, OOMKilled) rather than a pod that’s simply “not ready”.
That lets an investigation walk a symptom to its cause: start at the deployment a responder named, check its rollout conditions, list the pods behind it, and describe the one that’s failing to read the events that explain why. The ownership chain ties it together, so a single failing pod can be traced back to the deployment that owns it.
Logs and metrics live elsewhere
Kubernetes tells Nexus the state of your workloads. Pod logs come from a logging data source, such as Loki or Google Cloud Logging. Resource usage over time comes from a metrics data source such as Prometheus. Nexus combines them: the cluster shows a pod restarting, and your logs and metrics show what led up to it. Nexus learns the shape of each cluster automatically: its namespaces, the workloads that run in them, the label conventions your team uses, and the operators you’ve installed. That structure makes queries land on the right resource the first time. How that works is covered in How telemetry works.Connecting Kubernetes
Connect the cloud provider that hosts your clusters, and Nexus discovers them using that provider’s credentials. If your clusters aren’t discoverable that way, you can also connect one directly with a kubeconfig.Through AWS
Connect AWS with EKS among the selected services, and your clusters are discovered automatically across the regions you enable. Discovery and cluster access are granted in two different places, so EKS requires an additional step per cluster:- Discovery comes from the IAM policy on the role or user incident.io authenticates as:
eks:ListClustersandeks:DescribeCluster. - Reading workloads inside a cluster is granted on the cluster itself. Create an EKS access entry for that same principal, and associate the AWS-managed
AmazonEKSViewPolicywith it. That policy is read-only by design.
- Clusters whose authentication mode is
CONFIG_MAPonly. Access there is controlled solely by the in-clusteraws-authConfigMap, which we never modify, so the access entry above can’t grant anything. Switch the cluster toAPIorAPI_AND_CONFIG_MAPand it’ll be picked up on the next discovery. Switching is additive, so your existingaws-authmappings keep working, though AWS makes it a one-way change. If you’d rather not switch, connect the cluster directly with a kubeconfig instead, which doesn’t depend on the authentication mode at all. - Public clusters restricted to a CIDR allowlist. If the endpoint is public but locked to specific ranges, our egress isn’t in them. Use a private endpoint with a proxy instead.
Through Google Cloud
Connect Google Cloud and your GKE clusters are discovered automatically. The service account you grant Google Cloud is exchanged for cluster access, so each discovered cluster inherits those credentials.Enabling discovered clusters
One provider connection can surface many clusters, so discovered Kubernetes clusters are left disabled by default. Review the clusters that appear and enable the ones your team runs incidents against.Directly, with a kubeconfig
When a cluster can’t be reached through a provider, connect it on its own with a kubeconfig. This is the route for a self-managed cluster, a cluster on a provider we don’t discover yet, or an EKS cluster whose authentication mode isCONFIG_MAP only.
Add a telemetry data source, choose Kubernetes, and paste the kubeconfig for the cluster. We read the API server endpoint, the cluster CA certificate, and the bearer token from it.
The token only needs read access. Nexus issues get and list against namespaces, nodes, pods, services, events, endpoints, persistent volumes and claims, the apps workloads (deployments, replicasets, statefulsets, daemonsets), batch jobs and cronjobs, and ingresses and network policies. Bind a service account to a read-only ClusterRole covering those, and use its token.
A few resources are treated as optional, so a connection still works without them: ConfigMaps and ServiceAccounts (withhold these if they may hold sensitive data), and the ArgoCD and metrics-server resources that only matter if you run those add-ons. The connect form lists every scope with what it’s used for and tells you which are missing when you test.
If the cluster sits behind a proxy that authenticates the connection itself and injects the identity (e.g. Tailscale’s
Kubernetes API server proxy), connect it with no client credentials and pair it with a proxy so
requests arrive from inside your network.
Limit access to specific namespaces
On a directly connected cluster, you can limit the connection to an allowlist of namespaces. Choose Only specific namespaces on the connect form and name up to 250 of them. You can paste a comma-separated list. You can edit the list later on that connection in the dashboard. Nexus reads only those namespaces. A query that doesn’t name a namespace stays inside the allowlist, and a query for any other namespace is refused. We’ll help you generate a manifest that contains:- A ClusterRole granting API discovery. We use it to resolve the resource types your cluster serves.
- A ClusterRole granting the reads Nexus needs. On its own it grants nothing — nothing is bound to it cluster-wide.
- A RoleBinding in each namespace you named, granting that role inside that namespace only.
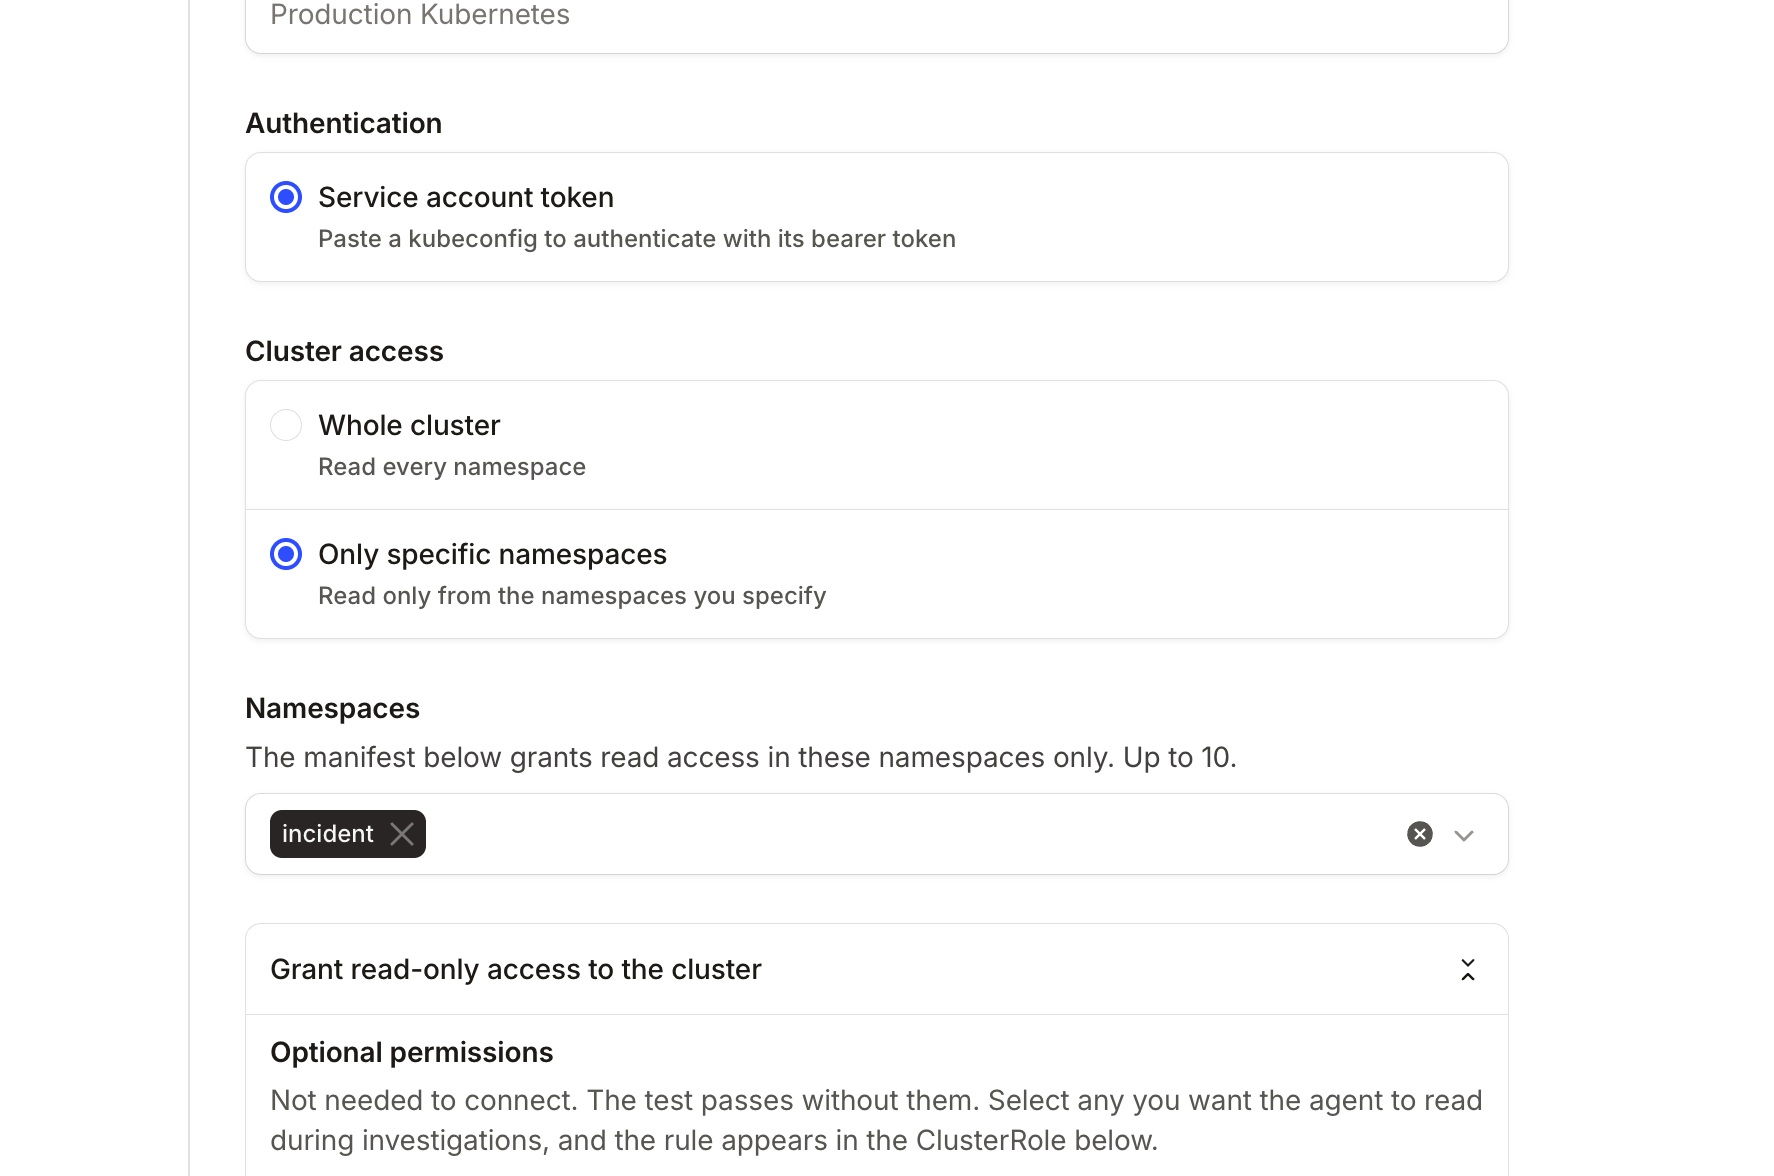
get on the kube-system namespace by name. That namespace’s UID is how we identify your cluster, so the grant covers it whether or not you named it. It reads the namespace object, not the workloads inside it.
When you specify the namespaces you want to give us access to, we won’t access:
- Node events. Nodes are cluster-scoped, so a scoped connection describes a node without its events.
- Persistent volumes. These are cluster-scoped, so the grant leaves them out. Persistent volume claims are namespaced and stay.
Best practice
- Grant the cloud provider read-only access. Nexus only ever reads cluster state, so a read-only role keeps the blast radius small.
- Enable the clusters your responders actually investigate (your production clusters) rather than every cluster the provider can see.
- Connect a logging and a metrics data source alongside Kubernetes. Cluster state shows you what failed; logs and metrics show you why.
Related
AWS
Connect AWS to discover your EKS clusters.
Google Cloud
Connect Google Cloud to discover your GKE clusters.
How telemetry works
How Nexus learns and queries your cluster.