How it works
The connector proxy is a lightweight service you deploy inside your network. When it starts up, it:- Opens an outbound SSH connection over port
443torelay.incident.io. - Authenticates using a token you generate when you create the connector.
- Establishes a reverse tunnel that lets incident.io reach the destinations you’ve allowed.
Prerequisites
Before you set up a connector, make sure you can:- Run a container or binary somewhere inside the network that hosts the data sources you want to expose. Most teams run the connector proxy in Kubernetes, ECS, or as a systemd service.
- Make outbound connections to
relay.incident.io:443from that environment. No inbound ports are required.
ssh command, and versions before 9.2 have a bug that breaks reverse forwarding. The published Docker image already includes a compatible version.
Setting up a connector
1
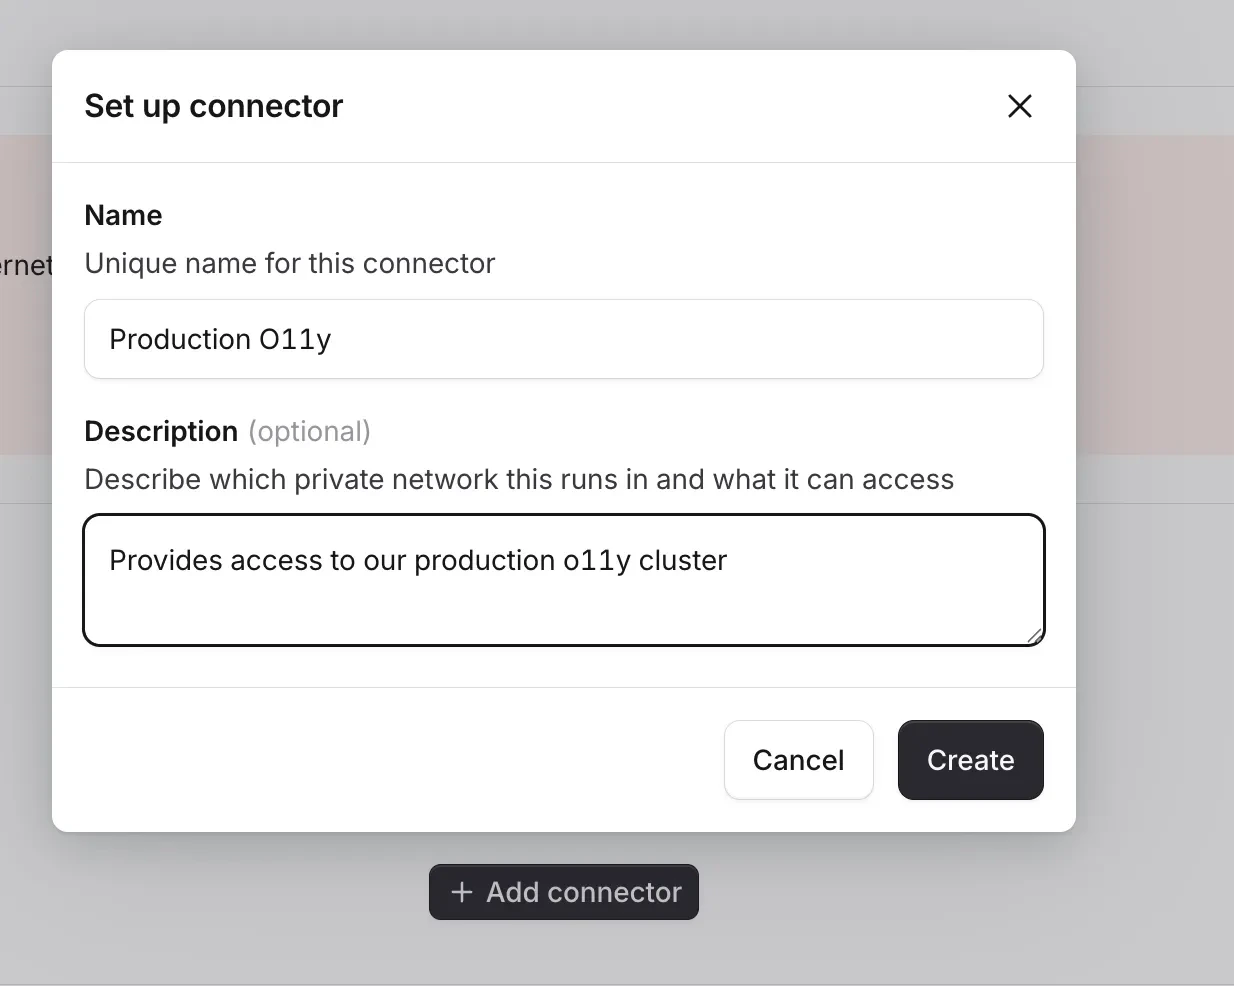
Create the connector in incident.io
Go to Settings → Connectors and click Add connector.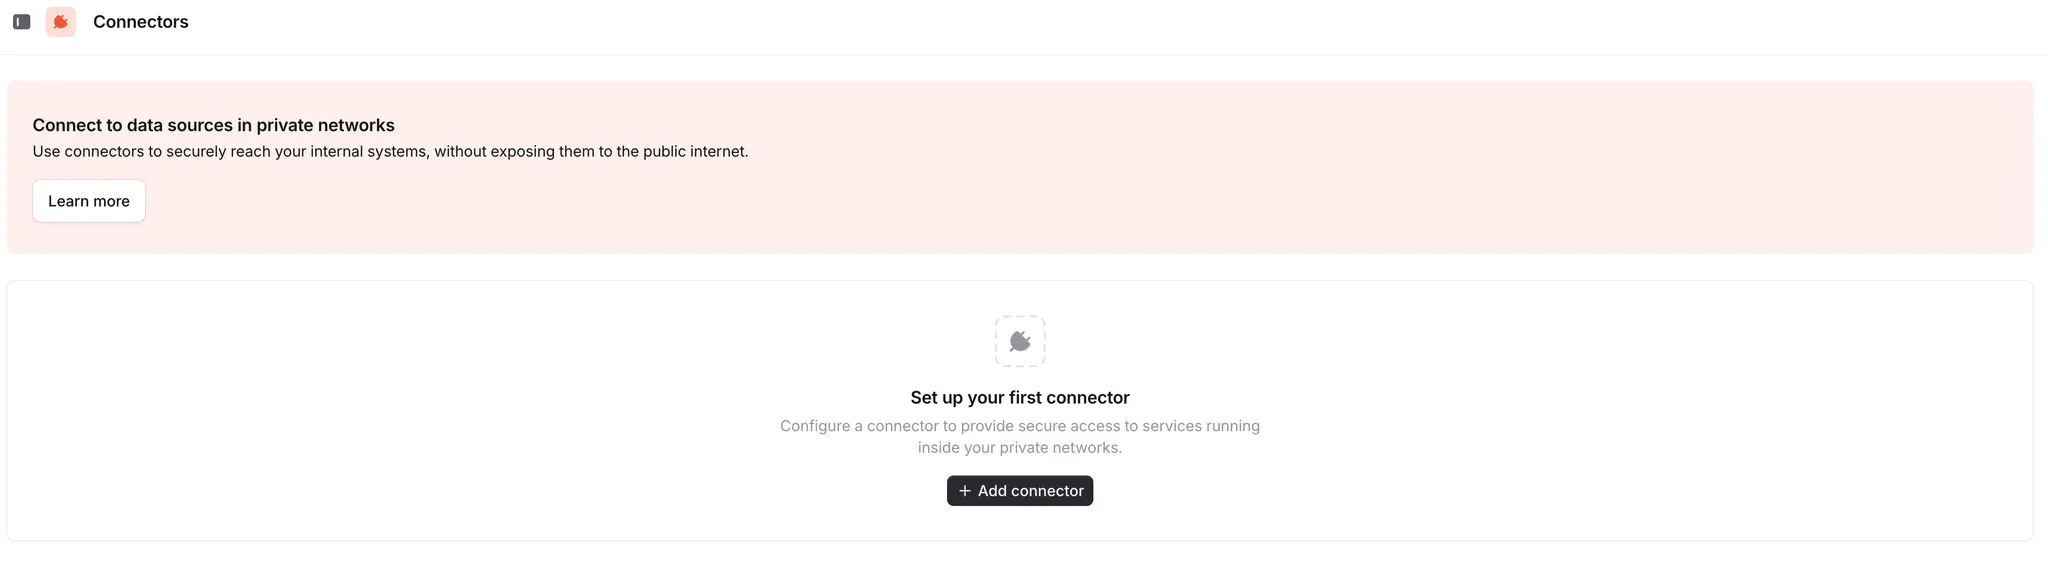
2
Generate a token
On the next screen, copy the Connector ID, then click Generate token.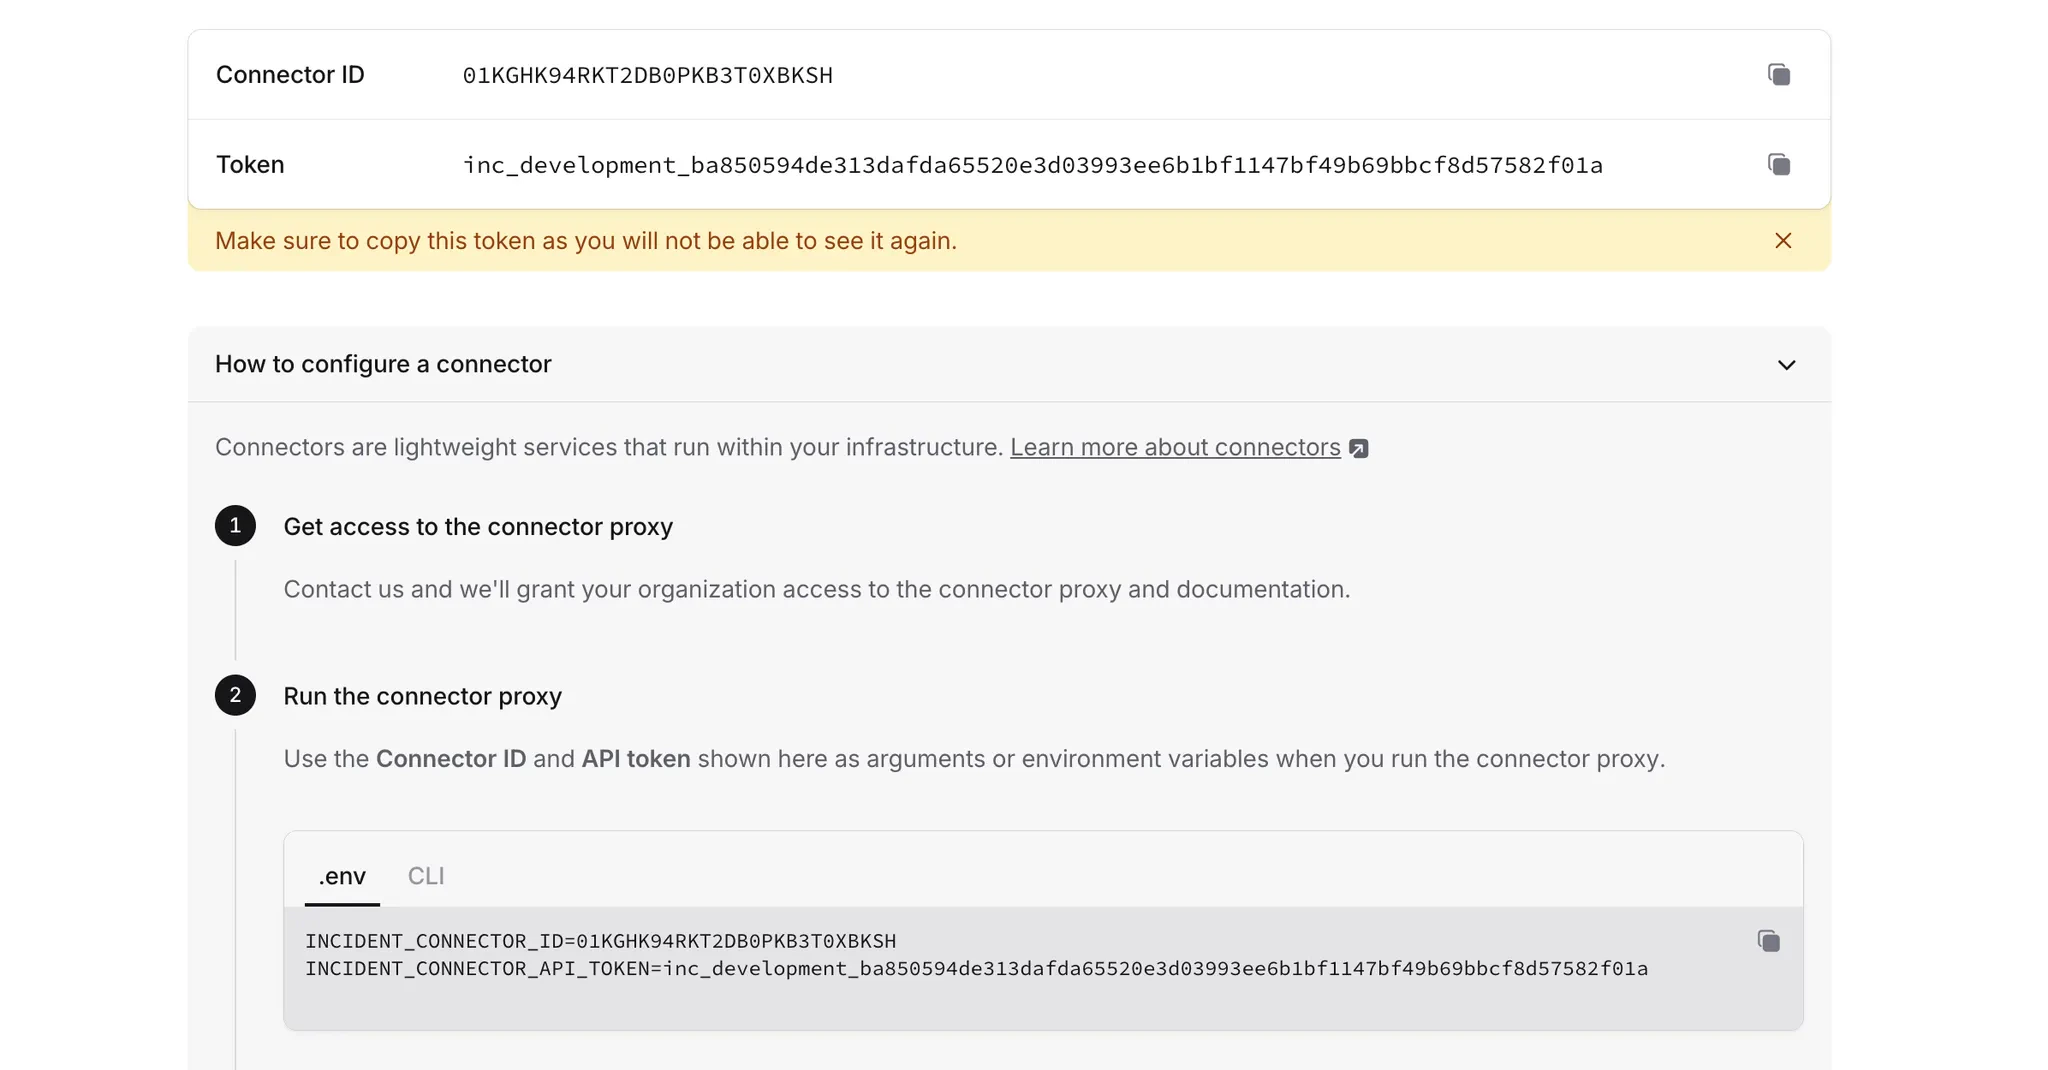
3
Run the connector proxy
The connector proxy is published as a Docker image at When the proxy connects successfully, you’ll see a log line like:Back in Settings → Connectors, the connector should now appear as online.
incidentio/connector-proxy. Pre-built binaries for Linux, macOS, and Windows are also available on the GitHub releases page.Pass the Connector ID and token you copied above as environment variables or flags:- Docker
- Kubernetes
- Binary
4
Attach a data source
Go to Investigations → Telemetry → Add data source and pick the type of data source you want to connect.Under Network access, select Private network and choose the connector you just created.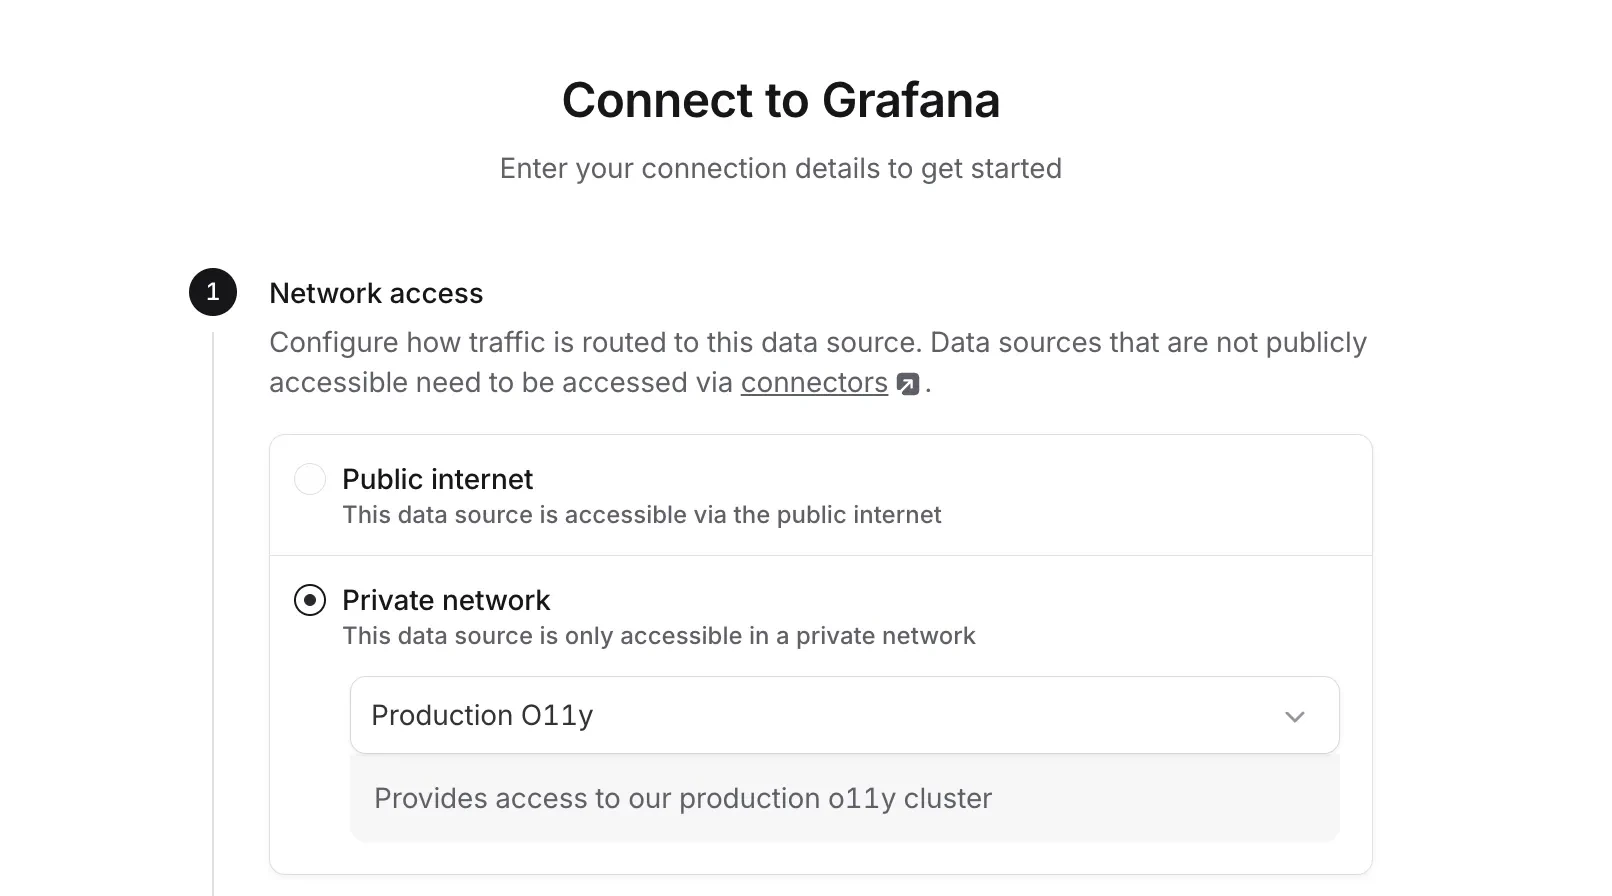
You can switch which connector a data source uses at any time from the data source’s Settings tab in Investigations telemetry.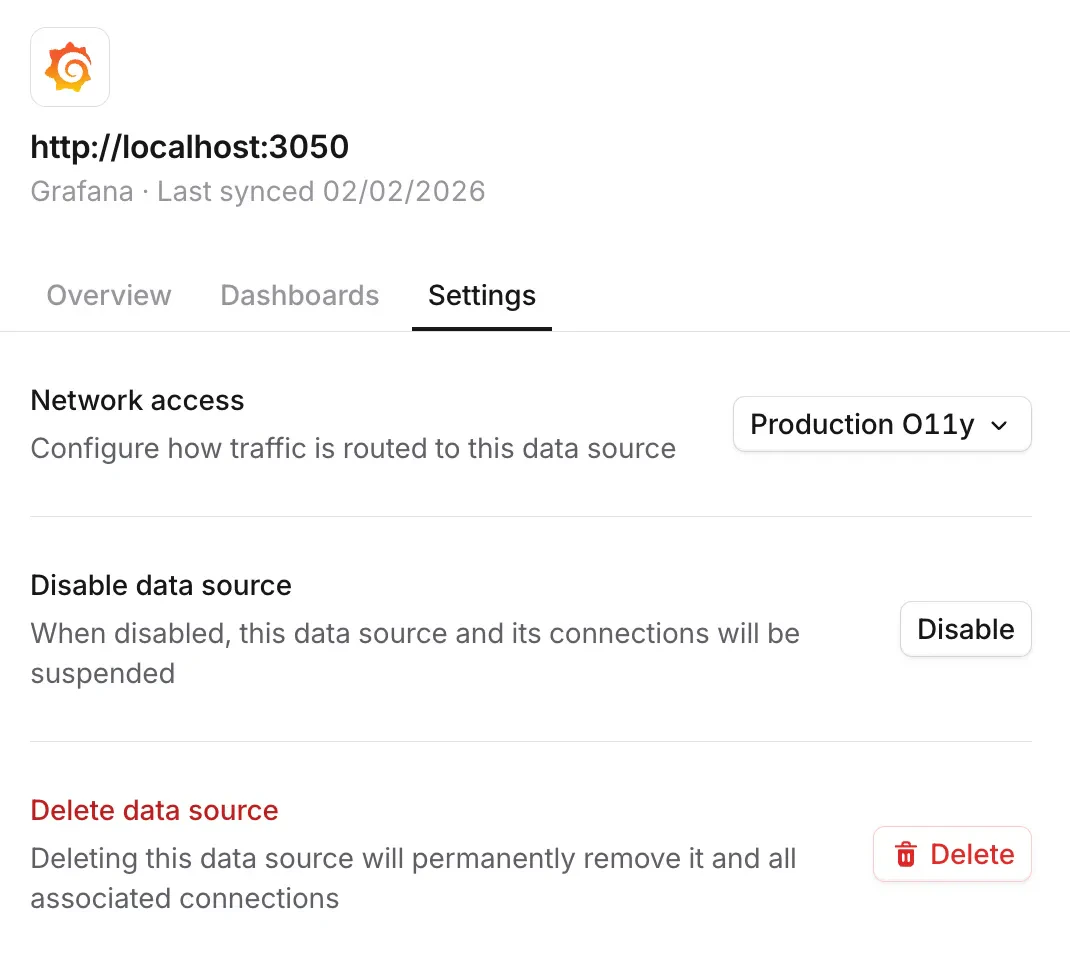
Restricting which services the proxy can reach
By default, the proxy will forward requests to any destination an investigation asks for, as long as it’s reachable from the network the proxy is running in. To narrow that down, set--forward-dest-allowlist (or INCIDENT_CONNECTOR_FORWARD_DEST_ALLOWLIST) to a space-separated list of host:port entries:
Troubleshooting
If your connector shows as offline in incident.io, the proxy either isn’t running or can’t reach our relay. Check the proxy logs and confirm it can make outbound connections torelay.incident.io:443.
If a data source’s Test connection fails:
- Proxy unreachable means incident.io can’t talk to your connector. Check that the proxy is running and online.
- Credentials incorrect means the connector reached the data source, but the credentials you supplied are wrong.
FAQs
What outbound connections does the proxy make?
What outbound connections does the proxy make?
The proxy opens a single SSH connection to
relay.incident.io on port 443. No inbound ports are required.How do I monitor the proxy?
How do I monitor the proxy?
The proxy exposes Prometheus metrics at
/metrics on port 9090. Point your scraper at that endpoint to ingest
proxy-level metrics.How do I restrict which services the proxy can reach?
How do I restrict which services the proxy can reach?
Use the
--forward-dest-allowlist flag (or INCIDENT_CONNECTOR_FORWARD_DEST_ALLOWLIST environment variable) to specify a space-separated list of host:port destinations. Any request to a destination outside the list is rejected.Examples:- Single host:
--forward-dest-allowlist="localhost:5432" - Multiple destinations:
--forward-dest-allowlist="db.internal:5432 api.internal:8080 redis.internal:6379"
Can I run more than one connector?
Can I run more than one connector?
Yes. Most teams run a separate connector per network they want to reach (for example, one per VPC or per environment).
Each data source picks the connector it should route through.
I have another question...
I have another question...
Reach out to us in our shared Slack channel. We’re happy to help.