> ## Documentation Index
> Fetch the complete documentation index at: https://docs.incident.io/llms.txt
> Use this file to discover all available pages before exploring further.
# Backfill uptime history on a new status page
> Remove the empty 'no data' bars on a new status page by backfilling operational history.
When you create a new status page, the uptime chart shows empty "no data" bars for any period before the page started recording data — even if your services were perfectly healthy at the time. You can backfill that history so those bars show as operational instead.
## Why new pages show "no data"
We only show uptime from the point a component first has data to report. Before that, we show "no data" rather than assuming the component was operational, because we have no record of its status either way.
To fill in that earlier period, give the chart a starting point: publish a **retrospective incident** whose earliest update is dated when you want the chart to begin (for example, the day your services went live). From that date onward, each component is shown as operational unless there's a recorded impact.
## Backfill your uptime
Go to your [status pages list](https://app.incident.io/~/status-pages) and select your page. Open the **⋯** menu in the top right and select **Publish retrospective incident**.
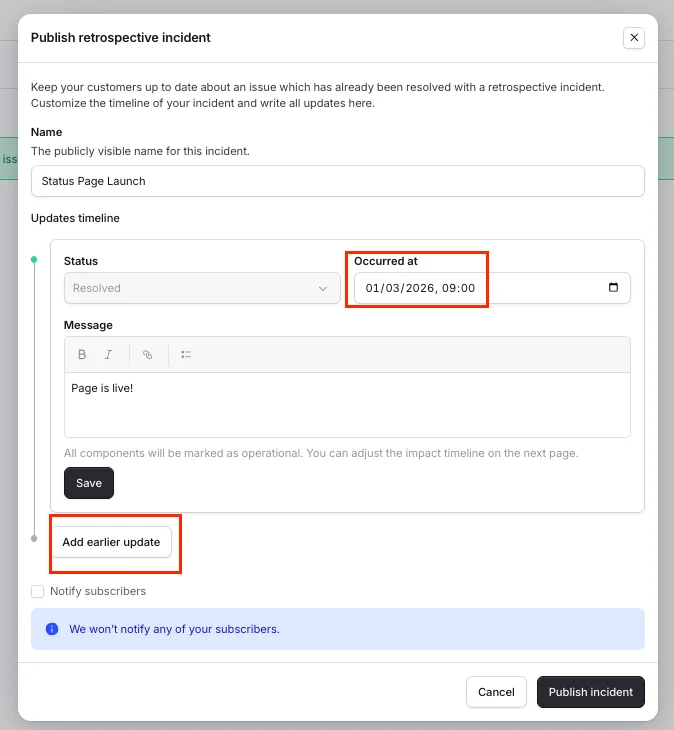
 Give the incident a name. The most recent update in the timeline must be **Resolved** — set its **Occurred at** to the date you want your uptime chart to start from, and add a short message. This update marks all components operational.
Then select **Add earlier update**.
Give the incident a name. The most recent update in the timeline must be **Resolved** — set its **Occurred at** to the date you want your uptime chart to start from, and add a short message. This update marks all components operational.
Then select **Add earlier update**.
 Set the earlier update's status to **Investigating** and its **Occurred at** to just before the resolved update (a minute earlier is fine). Add a message, then set the affected components to **Degraded performance**.
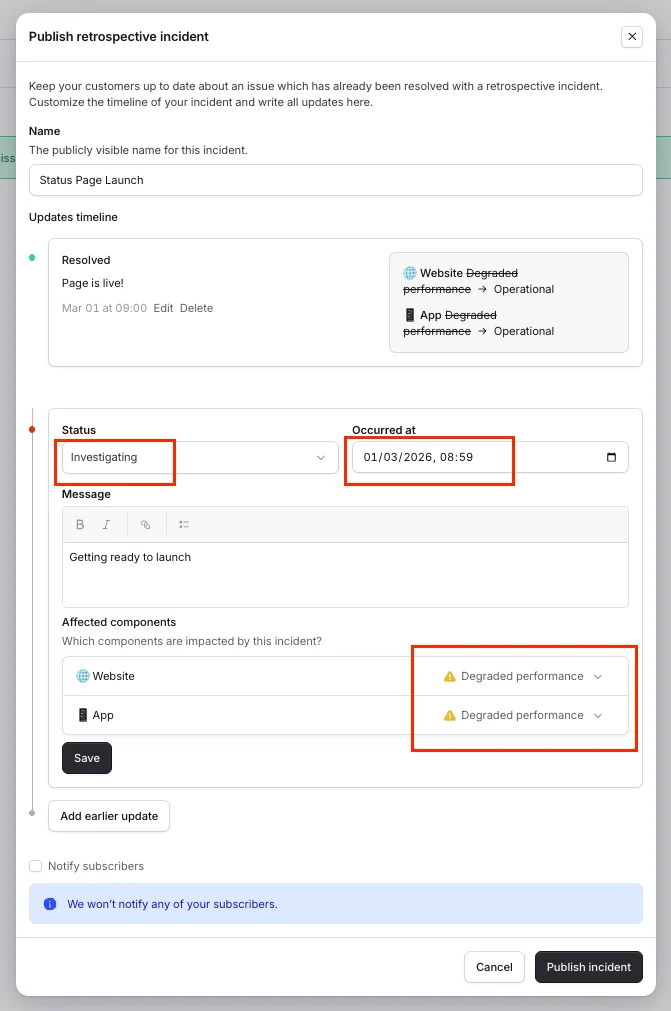 Setting the components to **Degraded performance** (rather than a partial or full outage) anchors your start date without counting as downtime, so your uptime stays at 100%. See [how we calculate uptime](/status-pages/uptime-calculation) for the statuses we count as "up" and "down".
Select **Save**, then **Publish incident**. Your uptime chart now starts from the date of the earliest update, and the empty "no data" bars before it show as operational.
This creates a resolved retrospective incident, which appears in your page's incident history. Publishing a
retrospective incident does not notify your subscribers by default.
## FAQs
The uptime chart only shows data from the point each component started recording it. Before that, we show "no data"
rather than assuming everything was operational. Publish a retrospective incident dated at your launch to backfill
that period.
Not if you set the anchoring impact to **Degraded performance** — degraded periods don't count as downtime. Only
partial and full outages reduce your uptime percentage. See [how we calculate
uptime](/status-pages/uptime-calculation).
Publishing a retrospective incident is the self-serve option, and it only ever moves your start date earlier. If
you'd prefer to set the date directly without an incident, reach out to our support team.
Not unless you choose to. Retrospective incidents don't notify subscribers by default — leave **Notify subscribers**
unchecked when you publish.
Setting the components to **Degraded performance** (rather than a partial or full outage) anchors your start date without counting as downtime, so your uptime stays at 100%. See [how we calculate uptime](/status-pages/uptime-calculation) for the statuses we count as "up" and "down".
Select **Save**, then **Publish incident**. Your uptime chart now starts from the date of the earliest update, and the empty "no data" bars before it show as operational.
This creates a resolved retrospective incident, which appears in your page's incident history. Publishing a
retrospective incident does not notify your subscribers by default.
## FAQs
The uptime chart only shows data from the point each component started recording it. Before that, we show "no data"
rather than assuming everything was operational. Publish a retrospective incident dated at your launch to backfill
that period.
Not if you set the anchoring impact to **Degraded performance** — degraded periods don't count as downtime. Only
partial and full outages reduce your uptime percentage. See [how we calculate
uptime](/status-pages/uptime-calculation).
Publishing a retrospective incident is the self-serve option, and it only ever moves your start date earlier. If
you'd prefer to set the date directly without an incident, reach out to our support team.
Not unless you choose to. Retrospective incidents don't notify subscribers by default — leave **Notify subscribers**
unchecked when you publish.