> ## Documentation Index
> Fetch the complete documentation index at: https://docs.incident.io/llms.txt
> Use this file to discover all available pages before exploring further.
# Connectors
> Securely connect AI SRE to data sources running in your private networks.
Connectors let AI SRE reach data sources that aren't exposed to the public internet — like a Grafana, Prometheus, or Loki instance running inside your VPC. You run a small proxy in your network that establishes an outbound, encrypted tunnel to incident.io. When AI SRE needs to query one of your private data sources during an investigation, the request travels through that tunnel.
## How it works
The connector proxy is a lightweight service you deploy inside your network. When it starts up, it:
1. Opens an outbound SSH connection over port `443` to `relay.incident.io`.
2. Authenticates using a token you generate when you create the connector.
3. Establishes a reverse tunnel that lets incident.io reach the destinations you've allowed.
You stay in control of what AI SRE can reach: only data sources you explicitly attach to a connector are routed through it, and you can restrict outbound destinations further with an allowlist.
## Prerequisites
Before you set up a connector, make sure you can:
* **Run a container or binary** somewhere inside the network that hosts the data sources you want to expose. Most teams run the connector proxy in Kubernetes, ECS, or as a systemd service.
* **Make outbound connections** to `relay.incident.io:443` from that environment. No inbound ports are required.
If you're running the binary directly (rather than the Docker image), you'll also need **OpenSSH 9.2 or newer** on the host. The proxy uses the system's `ssh` command, and versions before 9.2 have a bug that breaks reverse forwarding. The published Docker image already includes a compatible version.
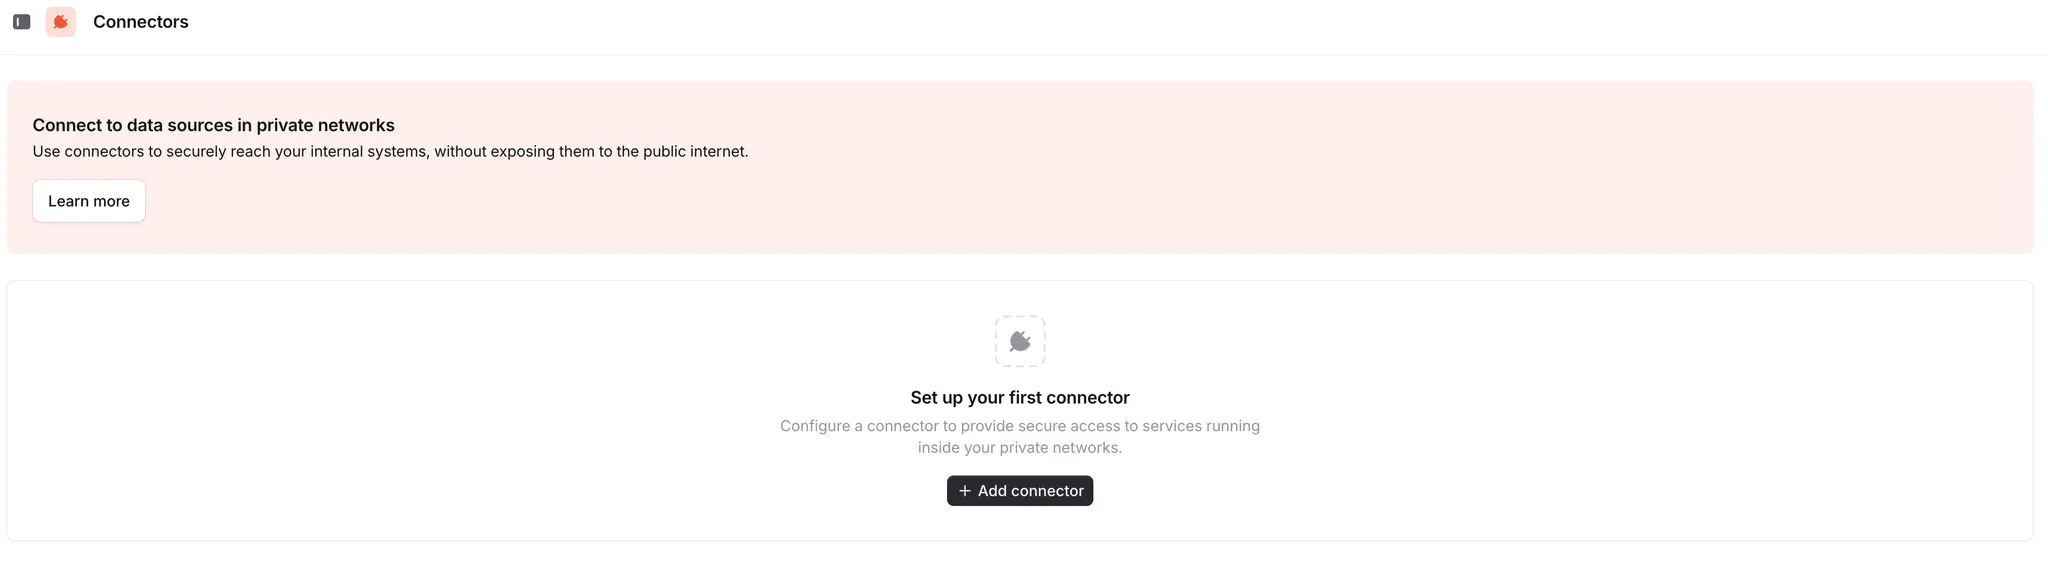
## Setting up a connector
Go to **Settings → [Connectors](https://app.incident.io/~/settings/connectors)** and click **Add connector**.
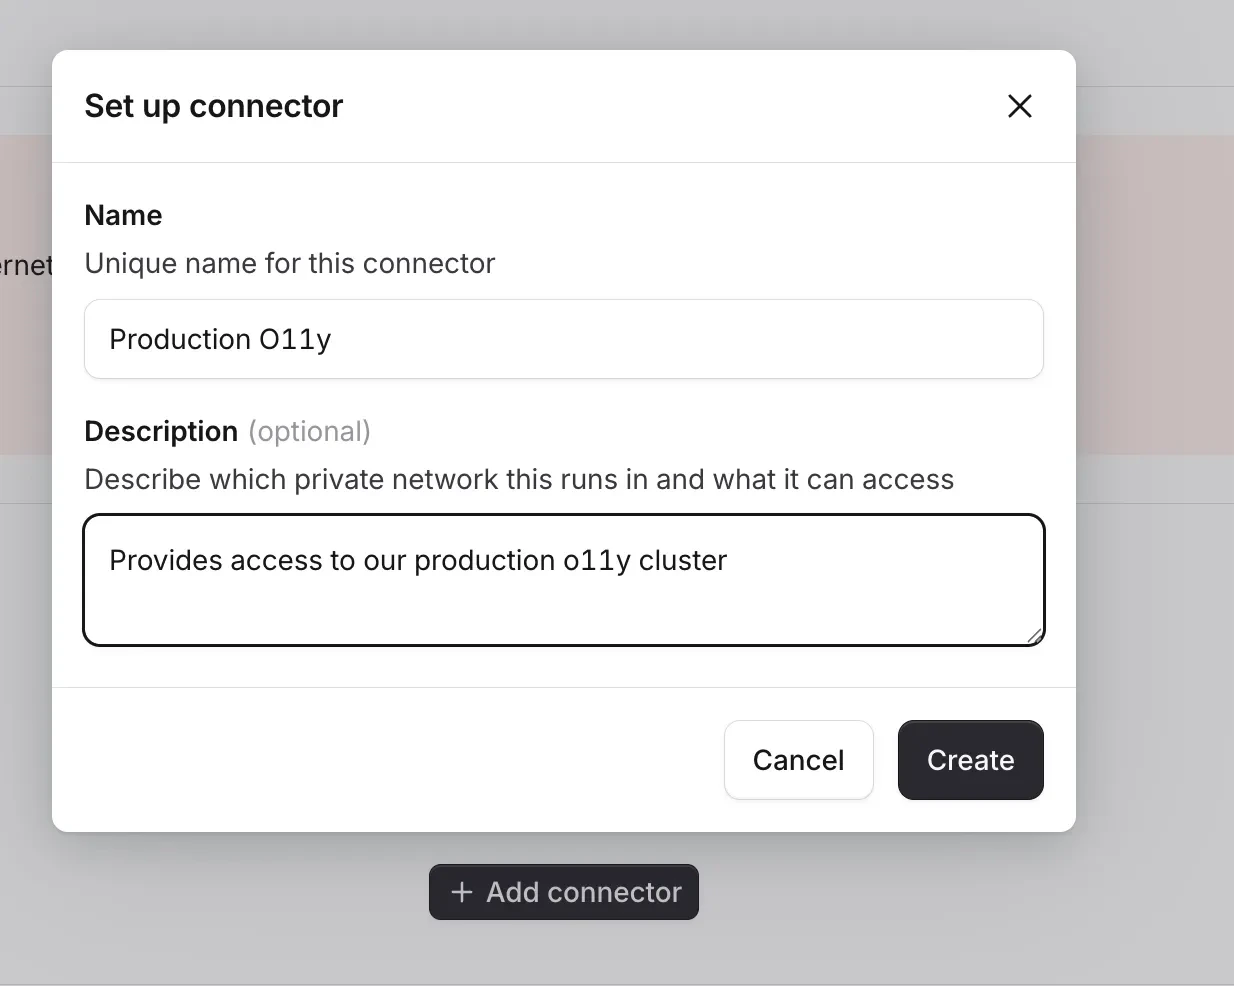
 Give the connector a name that reflects which network it runs in and what it can reach. The description is a good place to record the specific services it has access to.
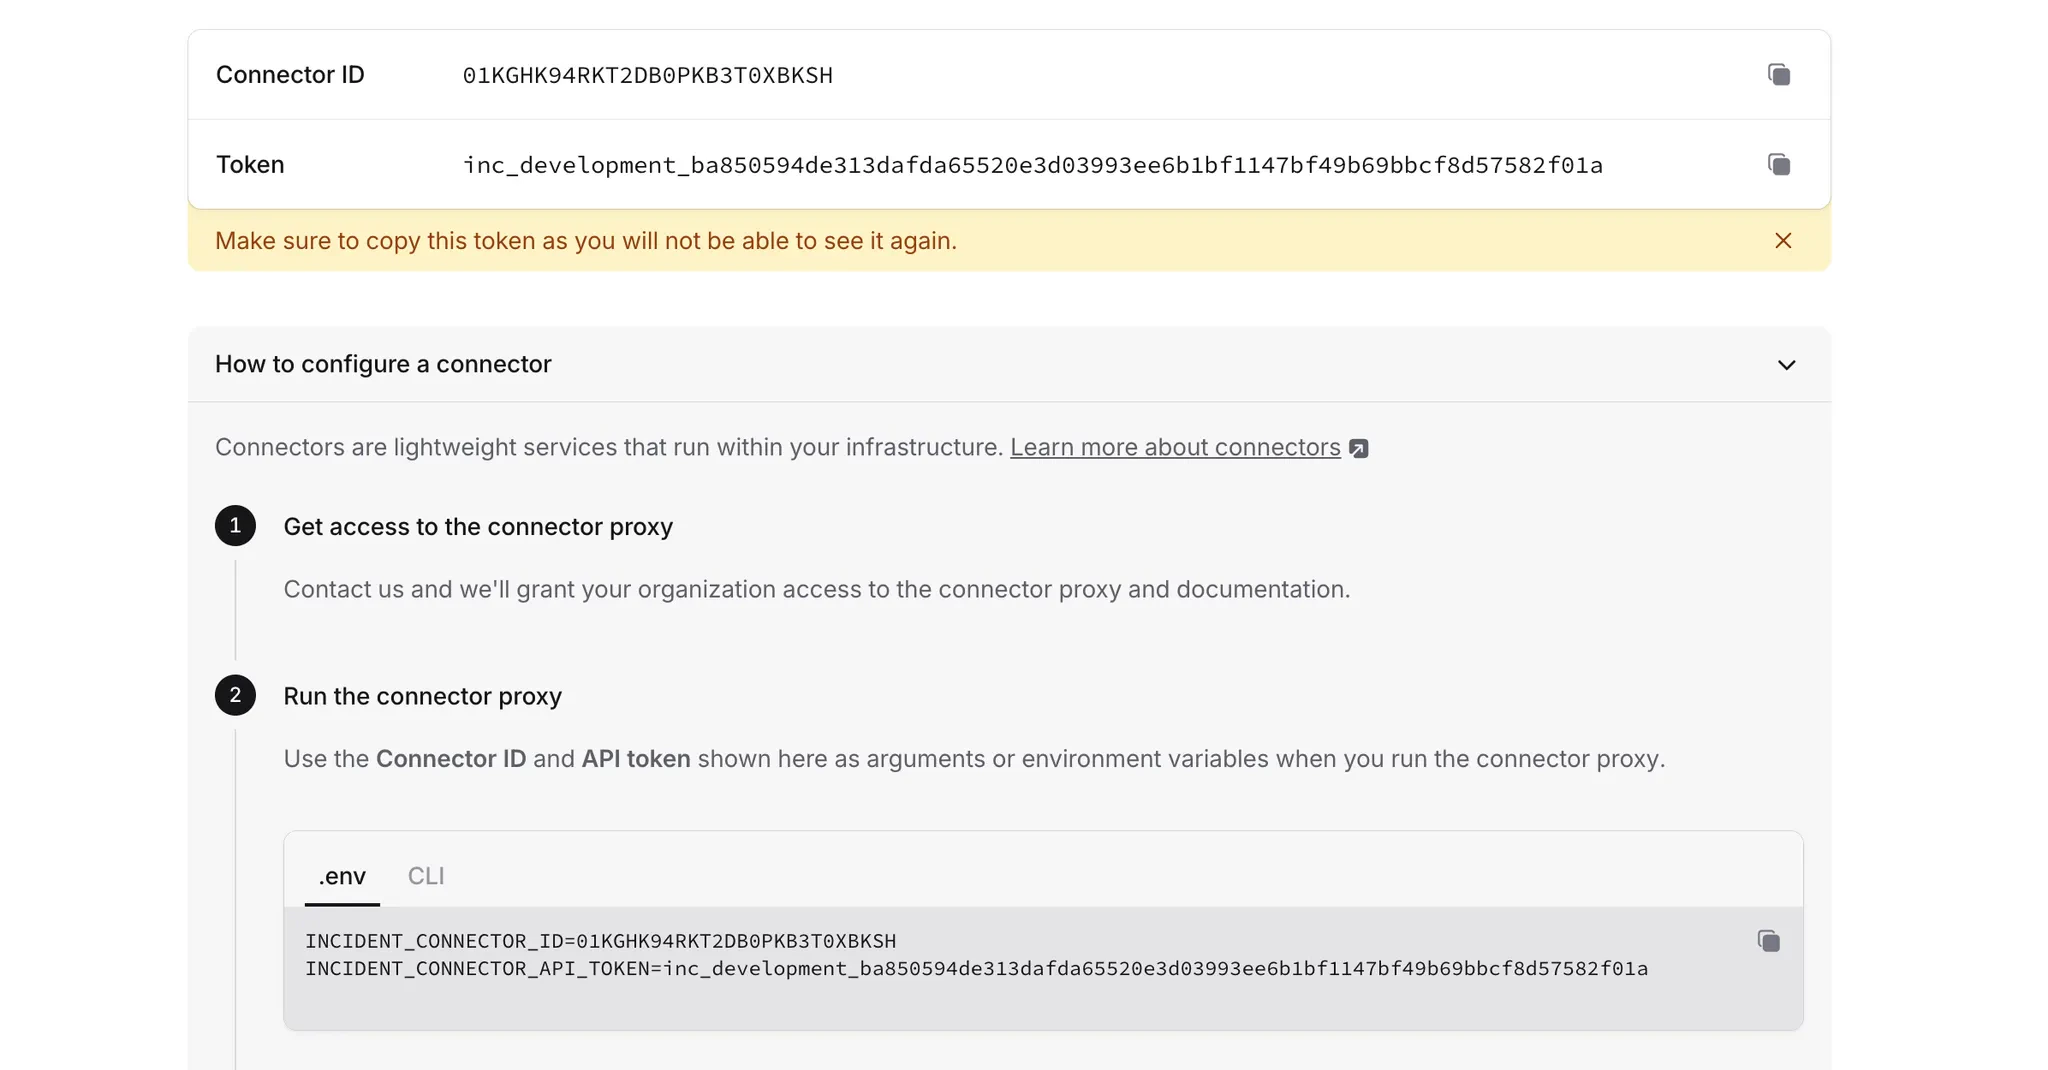
 On the next screen, copy the **Connector ID**, then click **Generate token**.
The token is shown only once — store it somewhere safe. You can regenerate it at any time, but the previous token stops working as soon as you do.
On the next screen, copy the **Connector ID**, then click **Generate token**.
The token is shown only once — store it somewhere safe. You can regenerate it at any time, but the previous token stops working as soon as you do.
 The connector proxy is published as a Docker image at [`incidentio/connector-proxy`](https://hub.docker.com/r/incidentio/connector-proxy). Pre-built binaries for Linux, macOS, and Windows are also available on the [GitHub releases page](https://github.com/incident-io/connector/releases).
Pass the **Connector ID** and **token** you copied above as environment variables or flags:
```bash theme={null}
docker run --rm \
-e INCIDENT_CONNECTOR_ID= \
-e INCIDENT_CONNECTOR_API_TOKEN= \
incidentio/connector-proxy
```
Store the token in a `Secret` and reference it from a `Deployment` so the token never appears in your manifests or pod spec. Three replicas gives you redundancy across nodes — the proxy reconnects on its own if a pod is rescheduled. The liveness probe checks the proxy's metrics endpoint on port 9090, so Kubernetes restarts a pod whose process becomes unresponsive.
```yaml connector.yaml theme={null}
apiVersion: v1
kind: Secret
metadata:
name: incident-connector
type: Opaque
stringData:
api-token:
---
apiVersion: apps/v1
kind: Deployment
metadata:
name: incident-connector
labels:
app.kubernetes.io/name: incident-connector
spec:
replicas: 3
selector:
matchLabels:
app.kubernetes.io/name: incident-connector
template:
metadata:
labels:
app.kubernetes.io/name: incident-connector
spec:
containers:
- name: connector-proxy
image: incidentio/connector-proxy:latest
env:
- name: INCIDENT_CONNECTOR_ID
value:
- name: INCIDENT_CONNECTOR_API_TOKEN
valueFrom:
secretKeyRef:
name: incident-connector
key: api-token
ports:
- containerPort: 9090
name: metrics
livenessProbe:
httpGet:
path: /metrics
port: metrics
resources:
requests:
cpu: 500m
memory: 128Mi
limits:
memory: 512Mi
securityContext:
allowPrivilegeEscalation: false
runAsNonRoot: true
runAsUser: 65532
capabilities:
drop: [ALL]
```
Apply it with `kubectl apply -f connector.yaml`. To restrict outbound destinations, add an `INCIDENT_CONNECTOR_FORWARD_DEST_ALLOWLIST` env var to the container (see [below](#restricting-which-services-the-proxy-can-reach)).
```bash theme={null}
./connector-proxy \
--connector-id= \
--api-token=
```
When the proxy connects successfully, you'll see a log line like:
```plaintext theme={null}
Allocated port 53990 for remote forward to socks
```
Back in **Settings → Connectors**, the connector should now appear as online.
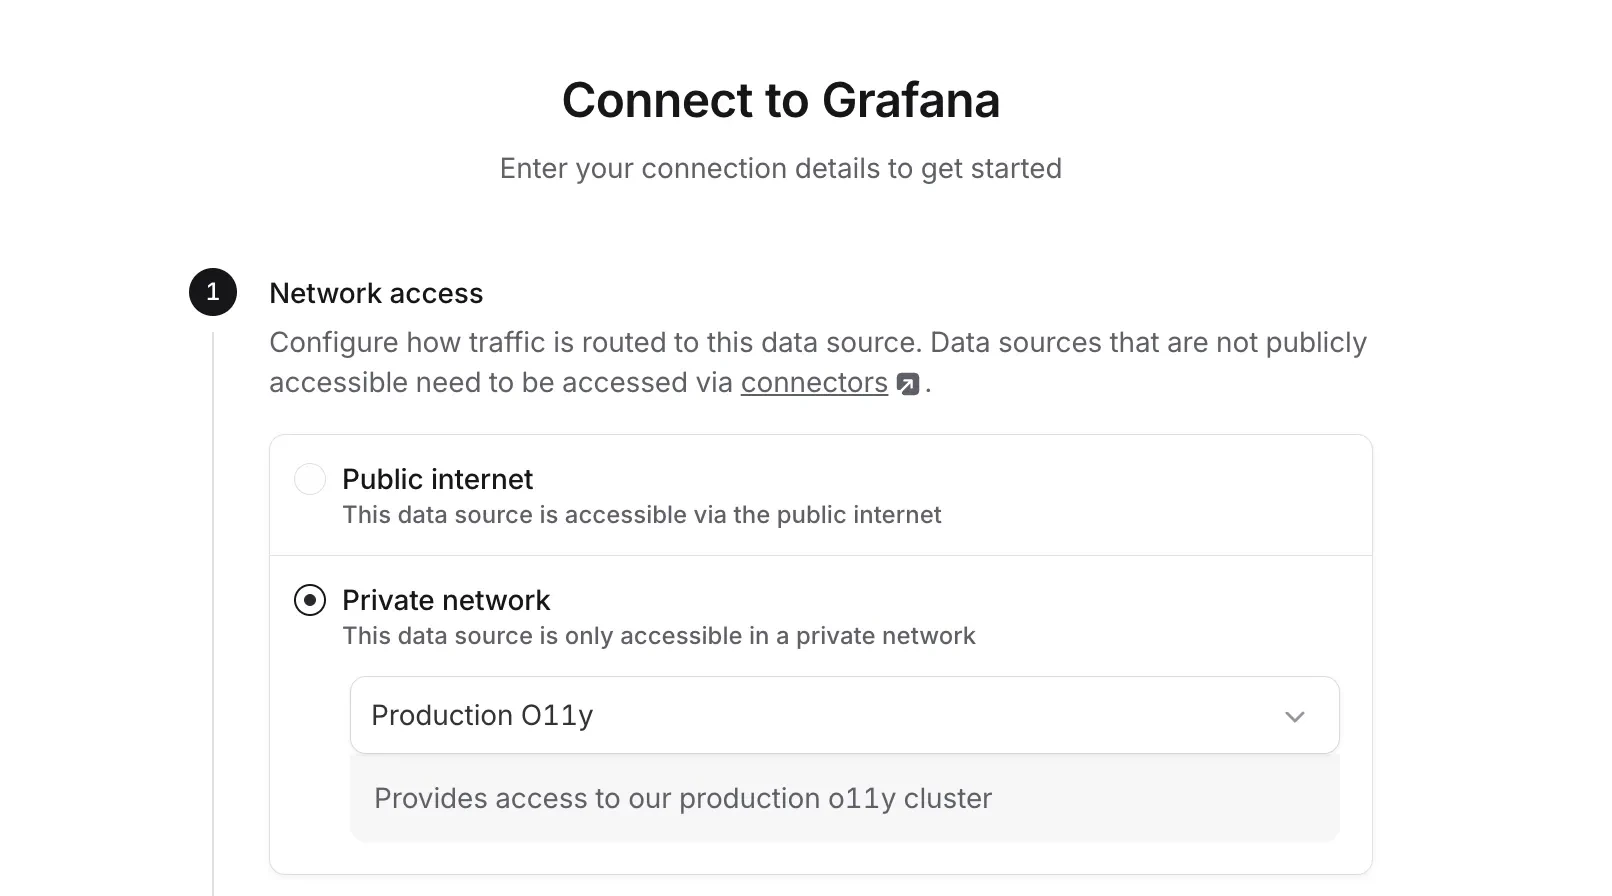
Go to **AI SRE → Telemetry → [Add data source](https://app.incident.io/~/ai-sre/telemetry/add)** and pick the type of data source you want to connect.
Under **Network access**, select **Private network** and choose the connector you just created.
The connector proxy is published as a Docker image at [`incidentio/connector-proxy`](https://hub.docker.com/r/incidentio/connector-proxy). Pre-built binaries for Linux, macOS, and Windows are also available on the [GitHub releases page](https://github.com/incident-io/connector/releases).
Pass the **Connector ID** and **token** you copied above as environment variables or flags:
```bash theme={null}
docker run --rm \
-e INCIDENT_CONNECTOR_ID= \
-e INCIDENT_CONNECTOR_API_TOKEN= \
incidentio/connector-proxy
```
Store the token in a `Secret` and reference it from a `Deployment` so the token never appears in your manifests or pod spec. Three replicas gives you redundancy across nodes — the proxy reconnects on its own if a pod is rescheduled. The liveness probe checks the proxy's metrics endpoint on port 9090, so Kubernetes restarts a pod whose process becomes unresponsive.
```yaml connector.yaml theme={null}
apiVersion: v1
kind: Secret
metadata:
name: incident-connector
type: Opaque
stringData:
api-token:
---
apiVersion: apps/v1
kind: Deployment
metadata:
name: incident-connector
labels:
app.kubernetes.io/name: incident-connector
spec:
replicas: 3
selector:
matchLabels:
app.kubernetes.io/name: incident-connector
template:
metadata:
labels:
app.kubernetes.io/name: incident-connector
spec:
containers:
- name: connector-proxy
image: incidentio/connector-proxy:latest
env:
- name: INCIDENT_CONNECTOR_ID
value:
- name: INCIDENT_CONNECTOR_API_TOKEN
valueFrom:
secretKeyRef:
name: incident-connector
key: api-token
ports:
- containerPort: 9090
name: metrics
livenessProbe:
httpGet:
path: /metrics
port: metrics
resources:
requests:
cpu: 500m
memory: 128Mi
limits:
memory: 512Mi
securityContext:
allowPrivilegeEscalation: false
runAsNonRoot: true
runAsUser: 65532
capabilities:
drop: [ALL]
```
Apply it with `kubectl apply -f connector.yaml`. To restrict outbound destinations, add an `INCIDENT_CONNECTOR_FORWARD_DEST_ALLOWLIST` env var to the container (see [below](#restricting-which-services-the-proxy-can-reach)).
```bash theme={null}
./connector-proxy \
--connector-id= \
--api-token=
```
When the proxy connects successfully, you'll see a log line like:
```plaintext theme={null}
Allocated port 53990 for remote forward to socks
```
Back in **Settings → Connectors**, the connector should now appear as online.
Go to **AI SRE → Telemetry → [Add data source](https://app.incident.io/~/ai-sre/telemetry/add)** and pick the type of data source you want to connect.
Under **Network access**, select **Private network** and choose the connector you just created.
 Finish configuring the data source and click **Test connection**. If everything is wired up correctly, the test should pass and you're ready to go.
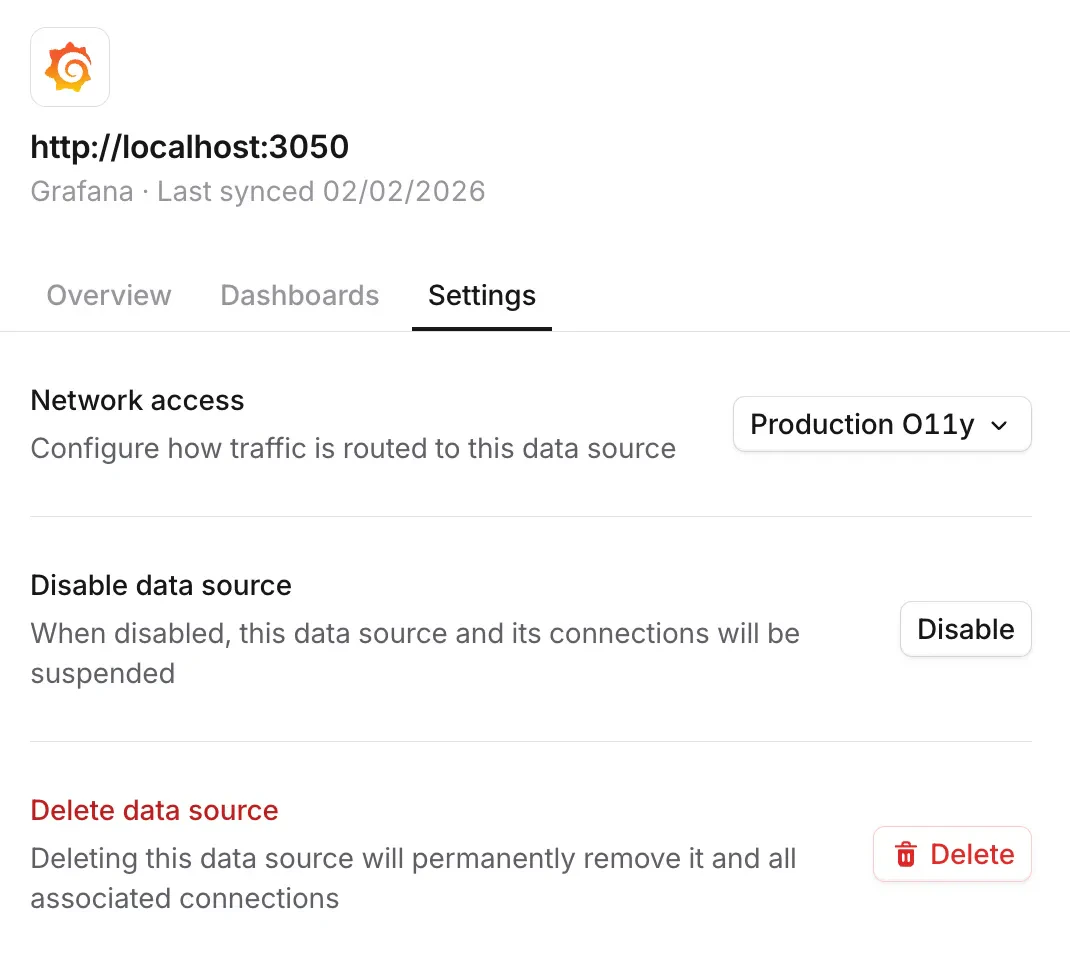
You can switch which connector a data source uses at any time from the data source's **Settings** tab in [AI SRE telemetry](https://app.incident.io/~/ai-sre/telemetry).
Finish configuring the data source and click **Test connection**. If everything is wired up correctly, the test should pass and you're ready to go.
You can switch which connector a data source uses at any time from the data source's **Settings** tab in [AI SRE telemetry](https://app.incident.io/~/ai-sre/telemetry).
 ## Restricting which services the proxy can reach
By default, the proxy will forward requests to any destination AI SRE asks for, as long as it's reachable from the network the proxy is running in. To narrow that down, set `--forward-dest-allowlist` (or `INCIDENT_CONNECTOR_FORWARD_DEST_ALLOWLIST`) to a space-separated list of `host:port` entries:
```bash theme={null}
./connector-proxy \
--connector-id= \
--api-token= \
--forward-dest-allowlist="grafana.internal:3000 prometheus.internal:9090"
```
Any destination not on the list is rejected. You can layer network policies on top of this for defense in depth.
## Troubleshooting
If your connector shows as **offline** in incident.io, the proxy either isn't running or can't reach our relay. Check the proxy logs and confirm it can make outbound connections to `relay.incident.io:443`.
If a data source's **Test connection** fails:
* **Proxy unreachable** means incident.io can't talk to your connector — check that the proxy is running and online.
* **Credentials incorrect** means the connector reached the data source, but the credentials you supplied are wrong.
## FAQs
The proxy opens a single SSH connection to `relay.incident.io` on port `443`. No inbound ports are required.
The proxy exposes Prometheus metrics at `/metrics` on port `9090`. Point your scraper at that endpoint to ingest
proxy-level metrics.
Use the `--forward-dest-allowlist` flag (or `INCIDENT_CONNECTOR_FORWARD_DEST_ALLOWLIST` environment variable) to specify a space-separated list of `host:port` destinations. Any request to a destination outside the list is rejected.
Examples:
* Single host: `--forward-dest-allowlist="localhost:5432"`
* Multiple destinations: `--forward-dest-allowlist="db.internal:5432 api.internal:8080 redis.internal:6379"`
You can also apply network policies in your infrastructure for an additional layer of control.
Yes. Most teams run a separate connector per network they want to reach (for example, one per VPC or per environment).
Each data source picks the connector it should route through.
Reach out to us in our shared Slack channel — we're happy to help.
## Restricting which services the proxy can reach
By default, the proxy will forward requests to any destination AI SRE asks for, as long as it's reachable from the network the proxy is running in. To narrow that down, set `--forward-dest-allowlist` (or `INCIDENT_CONNECTOR_FORWARD_DEST_ALLOWLIST`) to a space-separated list of `host:port` entries:
```bash theme={null}
./connector-proxy \
--connector-id= \
--api-token= \
--forward-dest-allowlist="grafana.internal:3000 prometheus.internal:9090"
```
Any destination not on the list is rejected. You can layer network policies on top of this for defense in depth.
## Troubleshooting
If your connector shows as **offline** in incident.io, the proxy either isn't running or can't reach our relay. Check the proxy logs and confirm it can make outbound connections to `relay.incident.io:443`.
If a data source's **Test connection** fails:
* **Proxy unreachable** means incident.io can't talk to your connector — check that the proxy is running and online.
* **Credentials incorrect** means the connector reached the data source, but the credentials you supplied are wrong.
## FAQs
The proxy opens a single SSH connection to `relay.incident.io` on port `443`. No inbound ports are required.
The proxy exposes Prometheus metrics at `/metrics` on port `9090`. Point your scraper at that endpoint to ingest
proxy-level metrics.
Use the `--forward-dest-allowlist` flag (or `INCIDENT_CONNECTOR_FORWARD_DEST_ALLOWLIST` environment variable) to specify a space-separated list of `host:port` destinations. Any request to a destination outside the list is rejected.
Examples:
* Single host: `--forward-dest-allowlist="localhost:5432"`
* Multiple destinations: `--forward-dest-allowlist="db.internal:5432 api.internal:8080 redis.internal:6379"`
You can also apply network policies in your infrastructure for an additional layer of control.
Yes. Most teams run a separate connector per network they want to reach (for example, one per VPC or per environment).
Each data source picks the connector it should route through.
Reach out to us in our shared Slack channel — we're happy to help.