> ## Documentation Index
> Fetch the complete documentation index at: https://docs.incident.io/llms.txt
> Use this file to discover all available pages before exploring further.
# Insights: Custom Dashboards
Custom dashboards are a powerful feature of Insights that let you build exactly the dashboard that you want to see. You can also [schedule reports to be sent based on a custom dashboard](/insights/scheduled-reports).
## Creating a custom dashboard
To create a new custom dashboard, go to the [Insights homepage](https://app.incident.io/~/insights), and click the "Create dashboard" button in the top right.
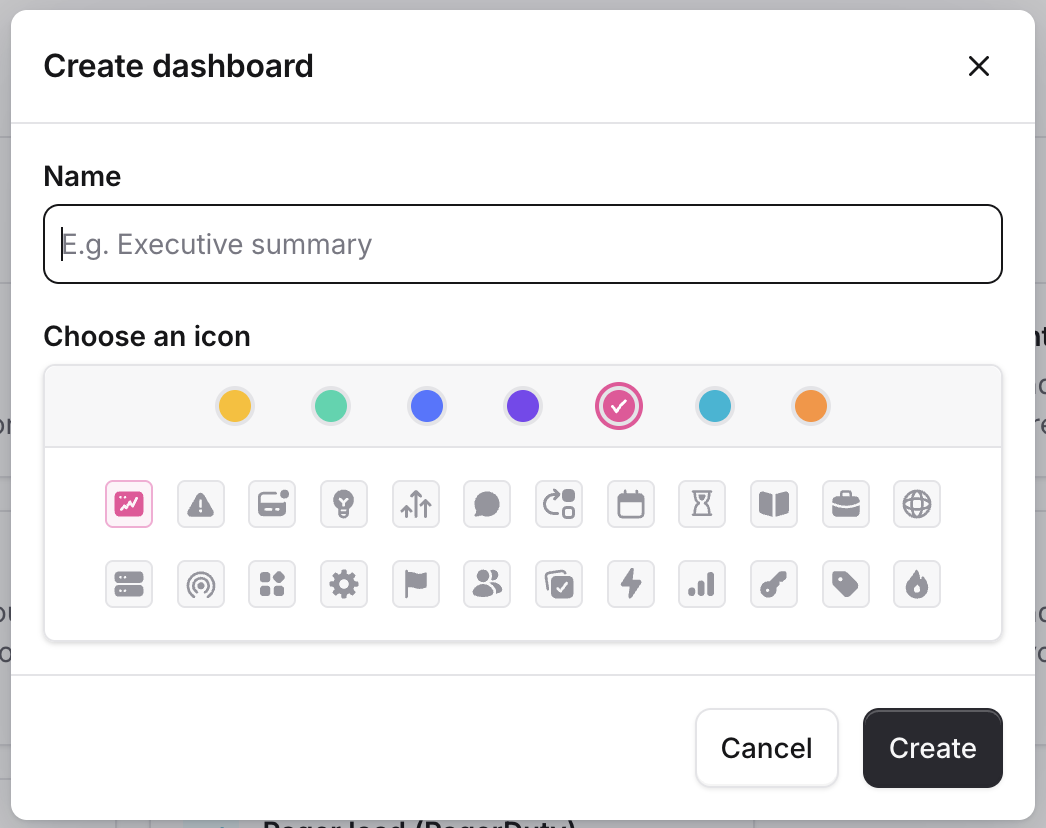 Give your custom dashboard a name, choose an icon and color, and then click Create.
## Adding panels
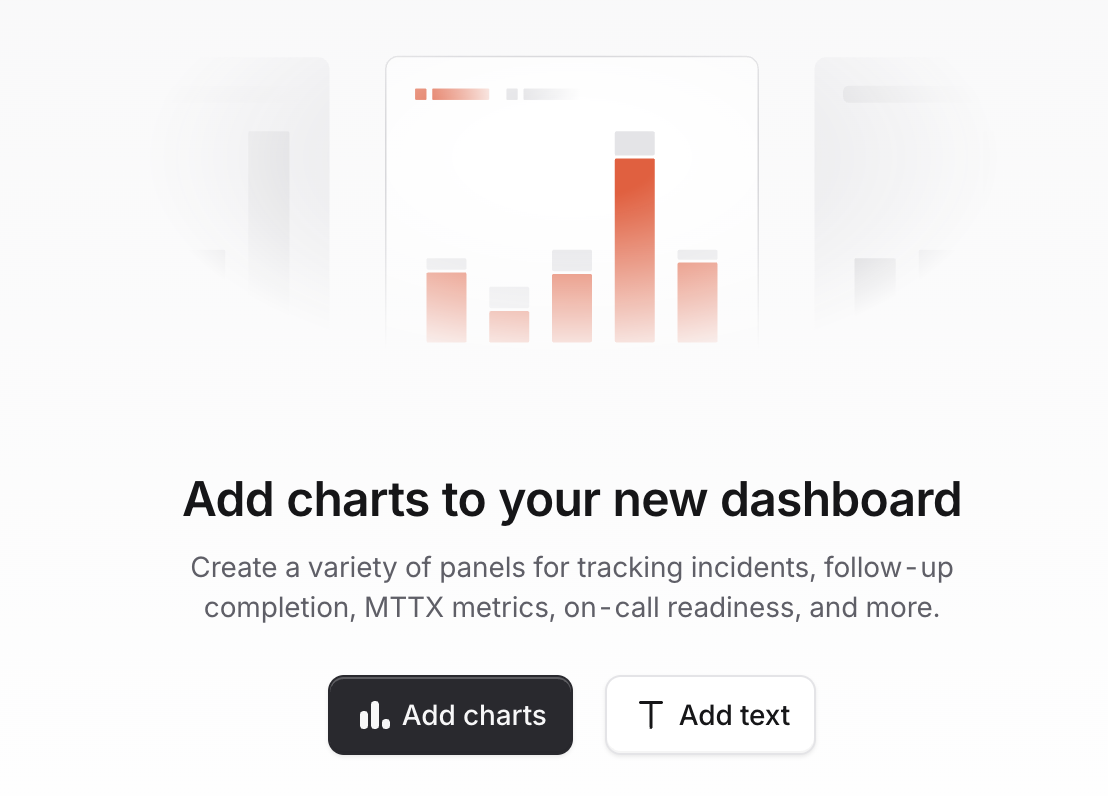
You can add panels containing either charts or text to your custom dashboard, simply click the corresponding button on your empty dashboard:
Give your custom dashboard a name, choose an icon and color, and then click Create.
## Adding panels
You can add panels containing either charts or text to your custom dashboard, simply click the corresponding button on your empty dashboard:
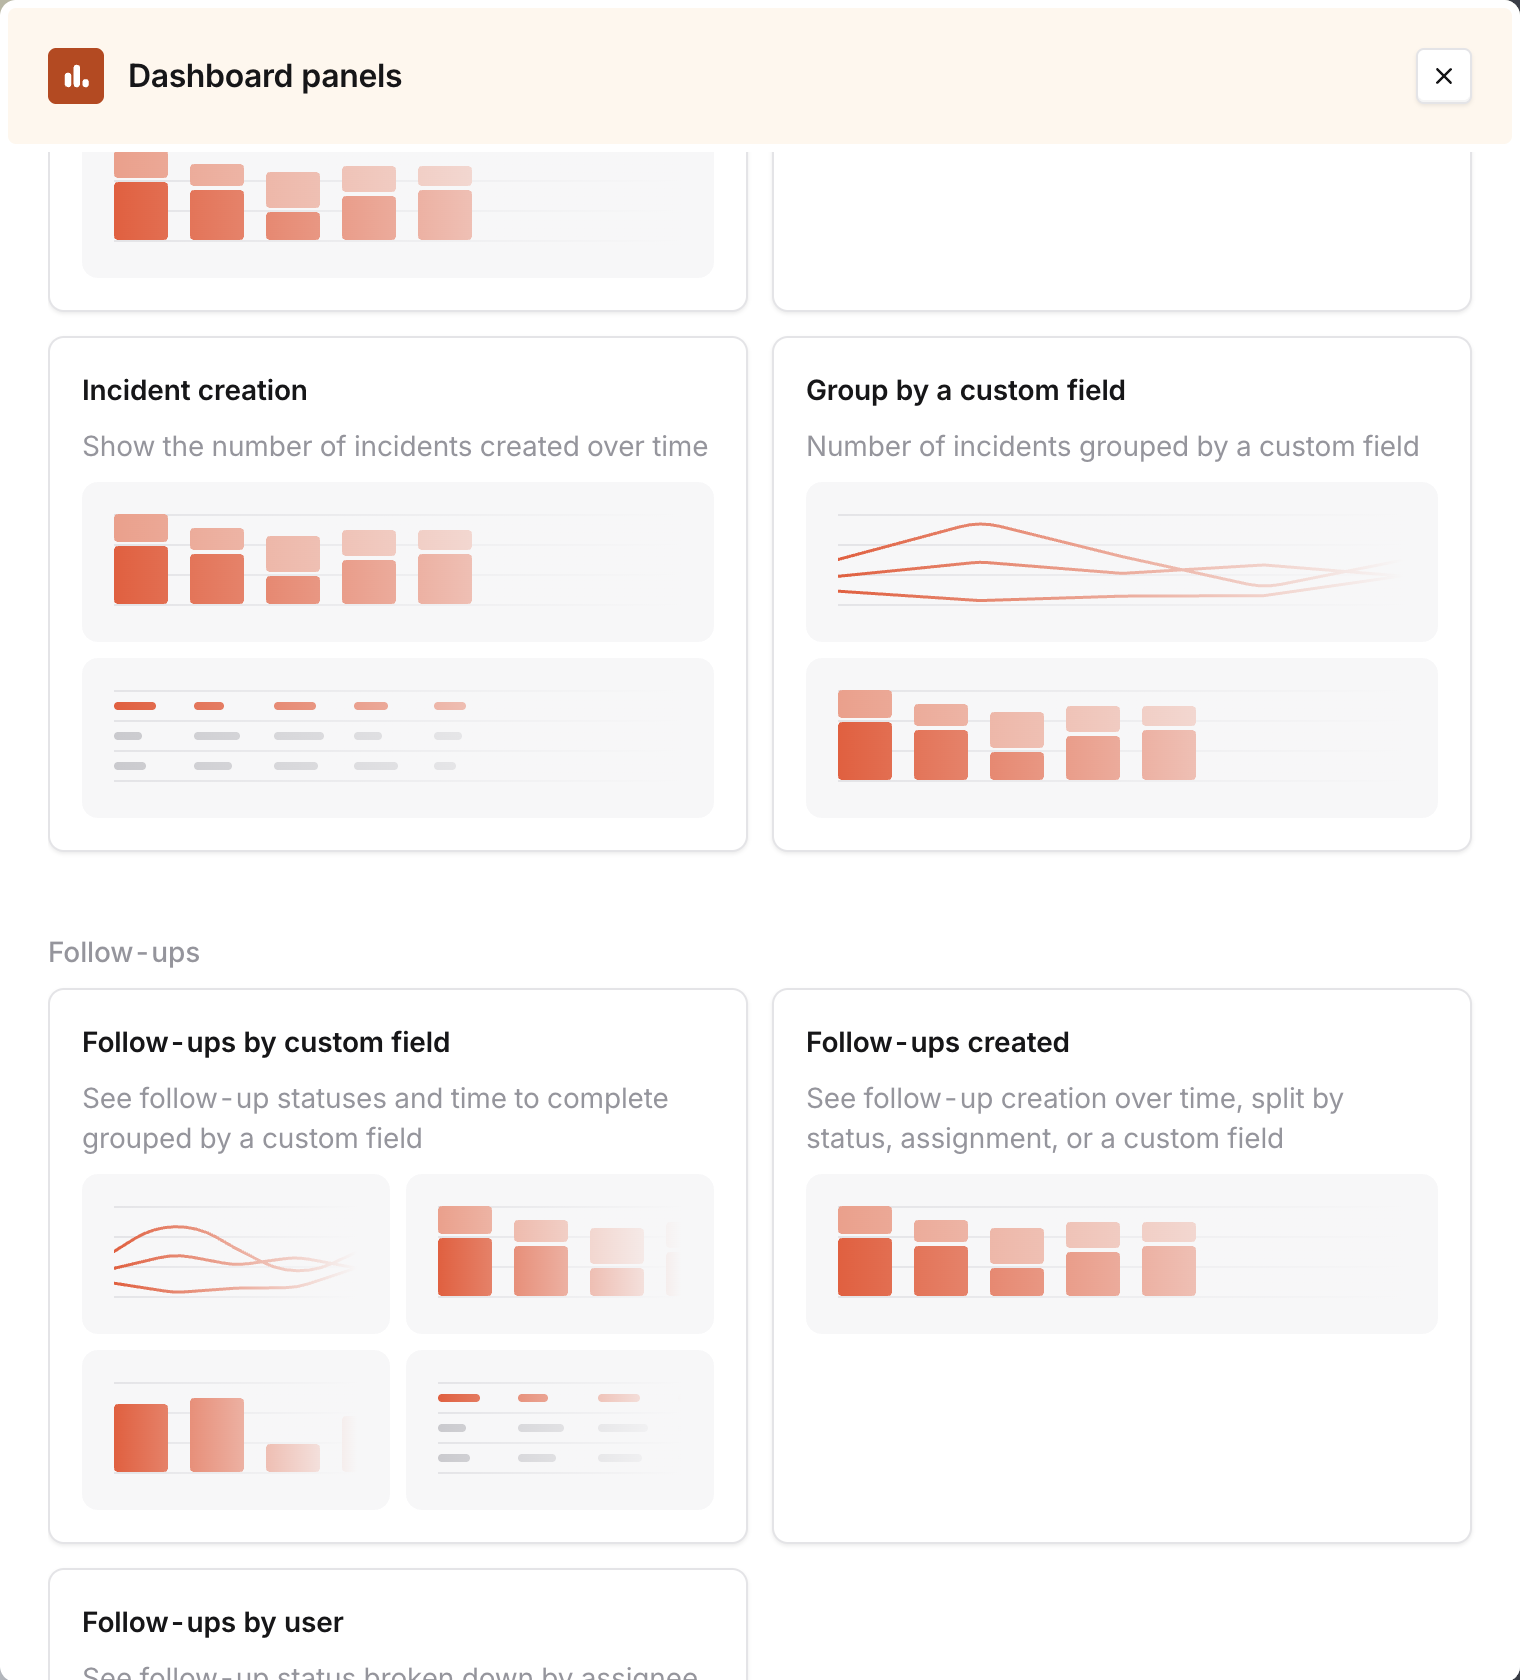
 You can add any panel from one of the core insights dashboards to your custom dashboard by selecting it from the drawer:
 ## Filtering the whole dashboard
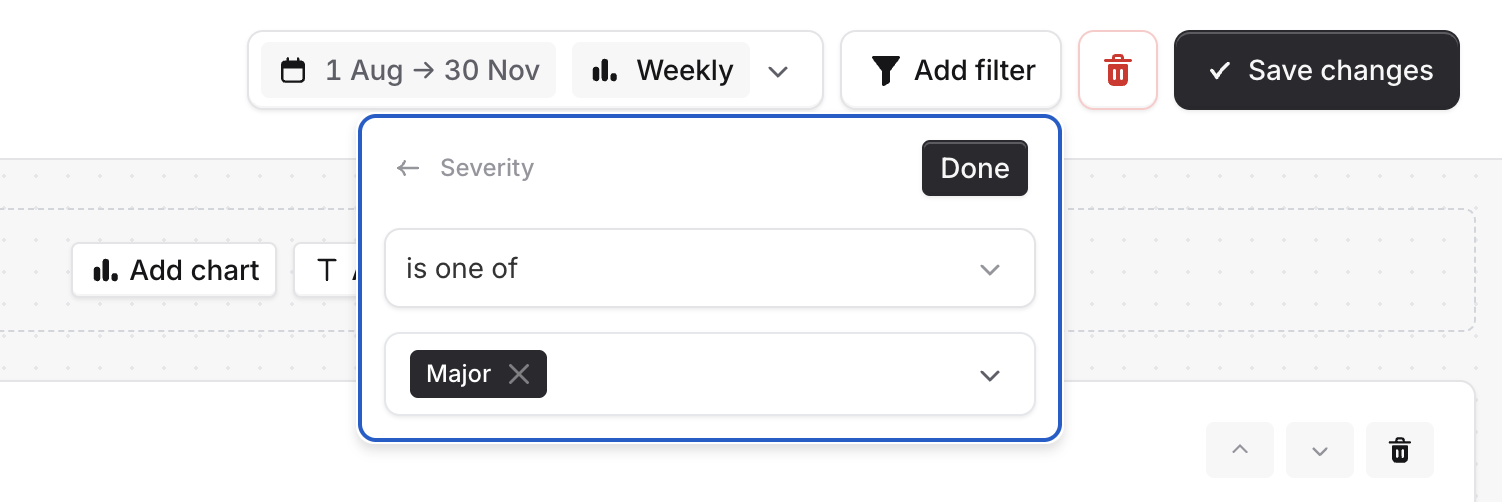
You can add filters to the dashboard, and **they will affect all panels on the dashboard**. For example, you can filter so that you only see data for major incidents by using the "Add filter" button in the header bar:
## Filtering the whole dashboard
You can add filters to the dashboard, and **they will affect all panels on the dashboard**. For example, you can filter so that you only see data for major incidents by using the "Add filter" button in the header bar:
 ## Filtering a panel
If you want to filter just a single panel in a custom dashboard, click the "Add filter" button in the header of the panel you want to filter:
## Filtering a panel
If you want to filter just a single panel in a custom dashboard, click the "Add filter" button in the header of the panel you want to filter:
 The filters you add to a panel **will be applied in addition** to the filters that are added to the whole dashboard.