> ## Documentation Index
> Fetch the complete documentation index at: https://docs.incident.io/llms.txt
> Use this file to discover all available pages before exploring further.
# Alert Insights
Understanding when and how your alerting system fires helps you configure it more effectively and cut down on noise. Less noise means fewer night-time pages, and happier responders.
The Alert insights dashboard splits into two halves. **Alerts created** is about volume: how many alerts are firing, where they're coming from, and which ones fire most often. **Alert acceptance** is about quality: how many of those alerts turn into accepted incidents and how many get declined as noise.
## Filters, date range, and comparison
The controls at the top of the dashboard apply to every panel below them.
* **Date range and aggregation**: pick any window and bucket it by day, week, or month. The default is the last 12 weeks bucketed by week.
* **Compare with previous period**: when enabled, every trend tile and chart shows the matching panel for the prior window of the same length, so you can see if things are trending up or down.
* **Filter**: filter by [alert attribute](/alerts/attributes-and-priorities), [priority](/alerts/priorities), alert source, whether alerts have related incidents, or whether they have related escalations.
## Alerts created
The **Alerts created** section answers "how much is my alerting system firing, and where is it coming from?"
### Total alert volume
The trend tile at the top shows the total number of alerts fired in the selected window, with a sentiment indicator comparing it to the previous period. Use it as a quick health check before drilling into the breakdowns below.
### Alerts created by source or attribute
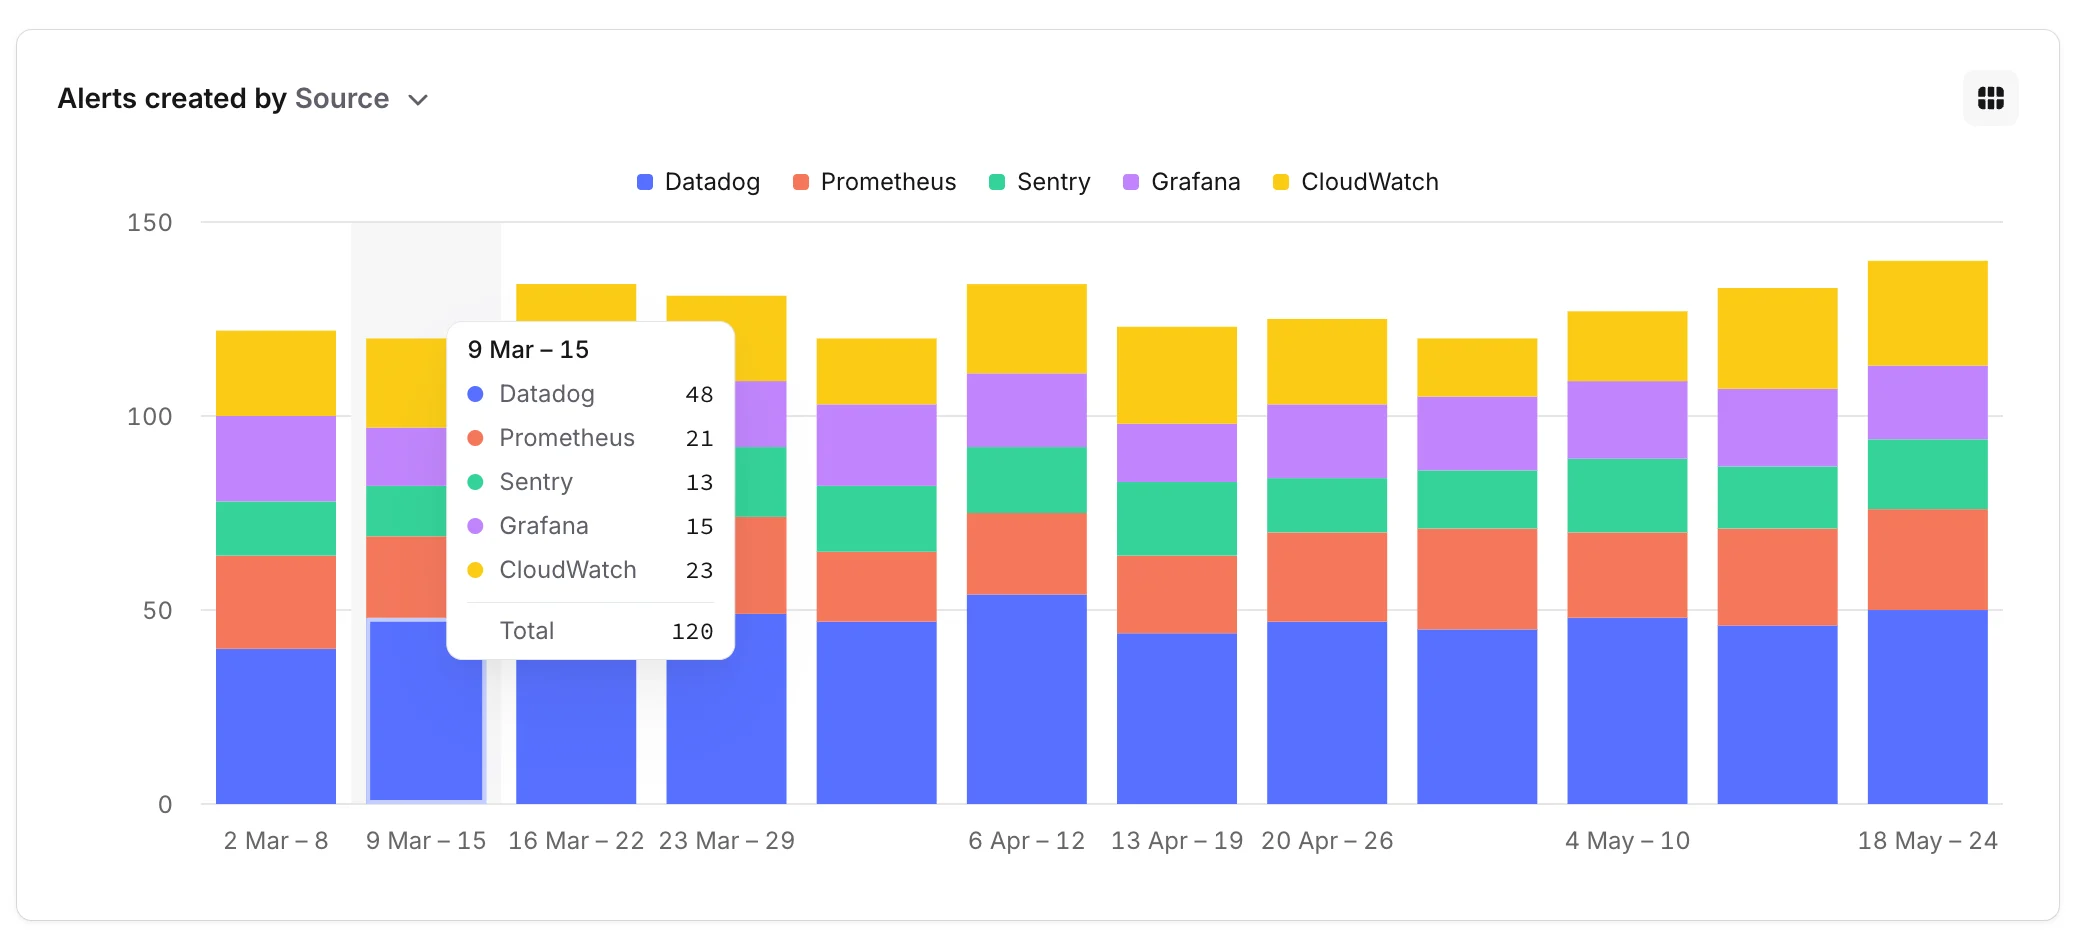
A stacked bar chart plots alert volume across the selected window. Use the **Alerts created by** selector above the chart to group by alert source or any catalog-backed [alert attribute](/alerts/attributes-and-priorities). This is the fastest way to see whether one product area is generating disproportionate noise, or whether one source is responsible for a spike.
Click any bar segment to open the [underlying alerts drawer](#underlying-alerts-drawer) for that slice. The **Underlying data** button next to the chart title opens the same drawer for the whole chart.
 ### Alert frequency
The **Alert frequency** table groups alerts by their title and ranks them by how often they fired. For each title you'll see:
* **Occurrences**: how many times the alert fired in the window.
* **Escalations**: how many of those occurrences escalated via [incident.io On-call](/on-call/escalation-paths). Escalations through other tools aren't counted here.
* **Total incidents**: how many incidents were created off the back of those alerts.
* **Last occurrence**: when the alert most recently fired.
You can filter the table inline by any of these columns, click a row to open the [underlying alerts drawer](#underlying-alerts-drawer) for that title, or use the **Export** button to download a CSV scoped to the current dashboard filters.
### Alert frequency
The **Alert frequency** table groups alerts by their title and ranks them by how often they fired. For each title you'll see:
* **Occurrences**: how many times the alert fired in the window.
* **Escalations**: how many of those occurrences escalated via [incident.io On-call](/on-call/escalation-paths). Escalations through other tools aren't counted here.
* **Total incidents**: how many incidents were created off the back of those alerts.
* **Last occurrence**: when the alert most recently fired.
You can filter the table inline by any of these columns, click a row to open the [underlying alerts drawer](#underlying-alerts-drawer) for that title, or use the **Export** button to download a CSV scoped to the current dashboard filters.
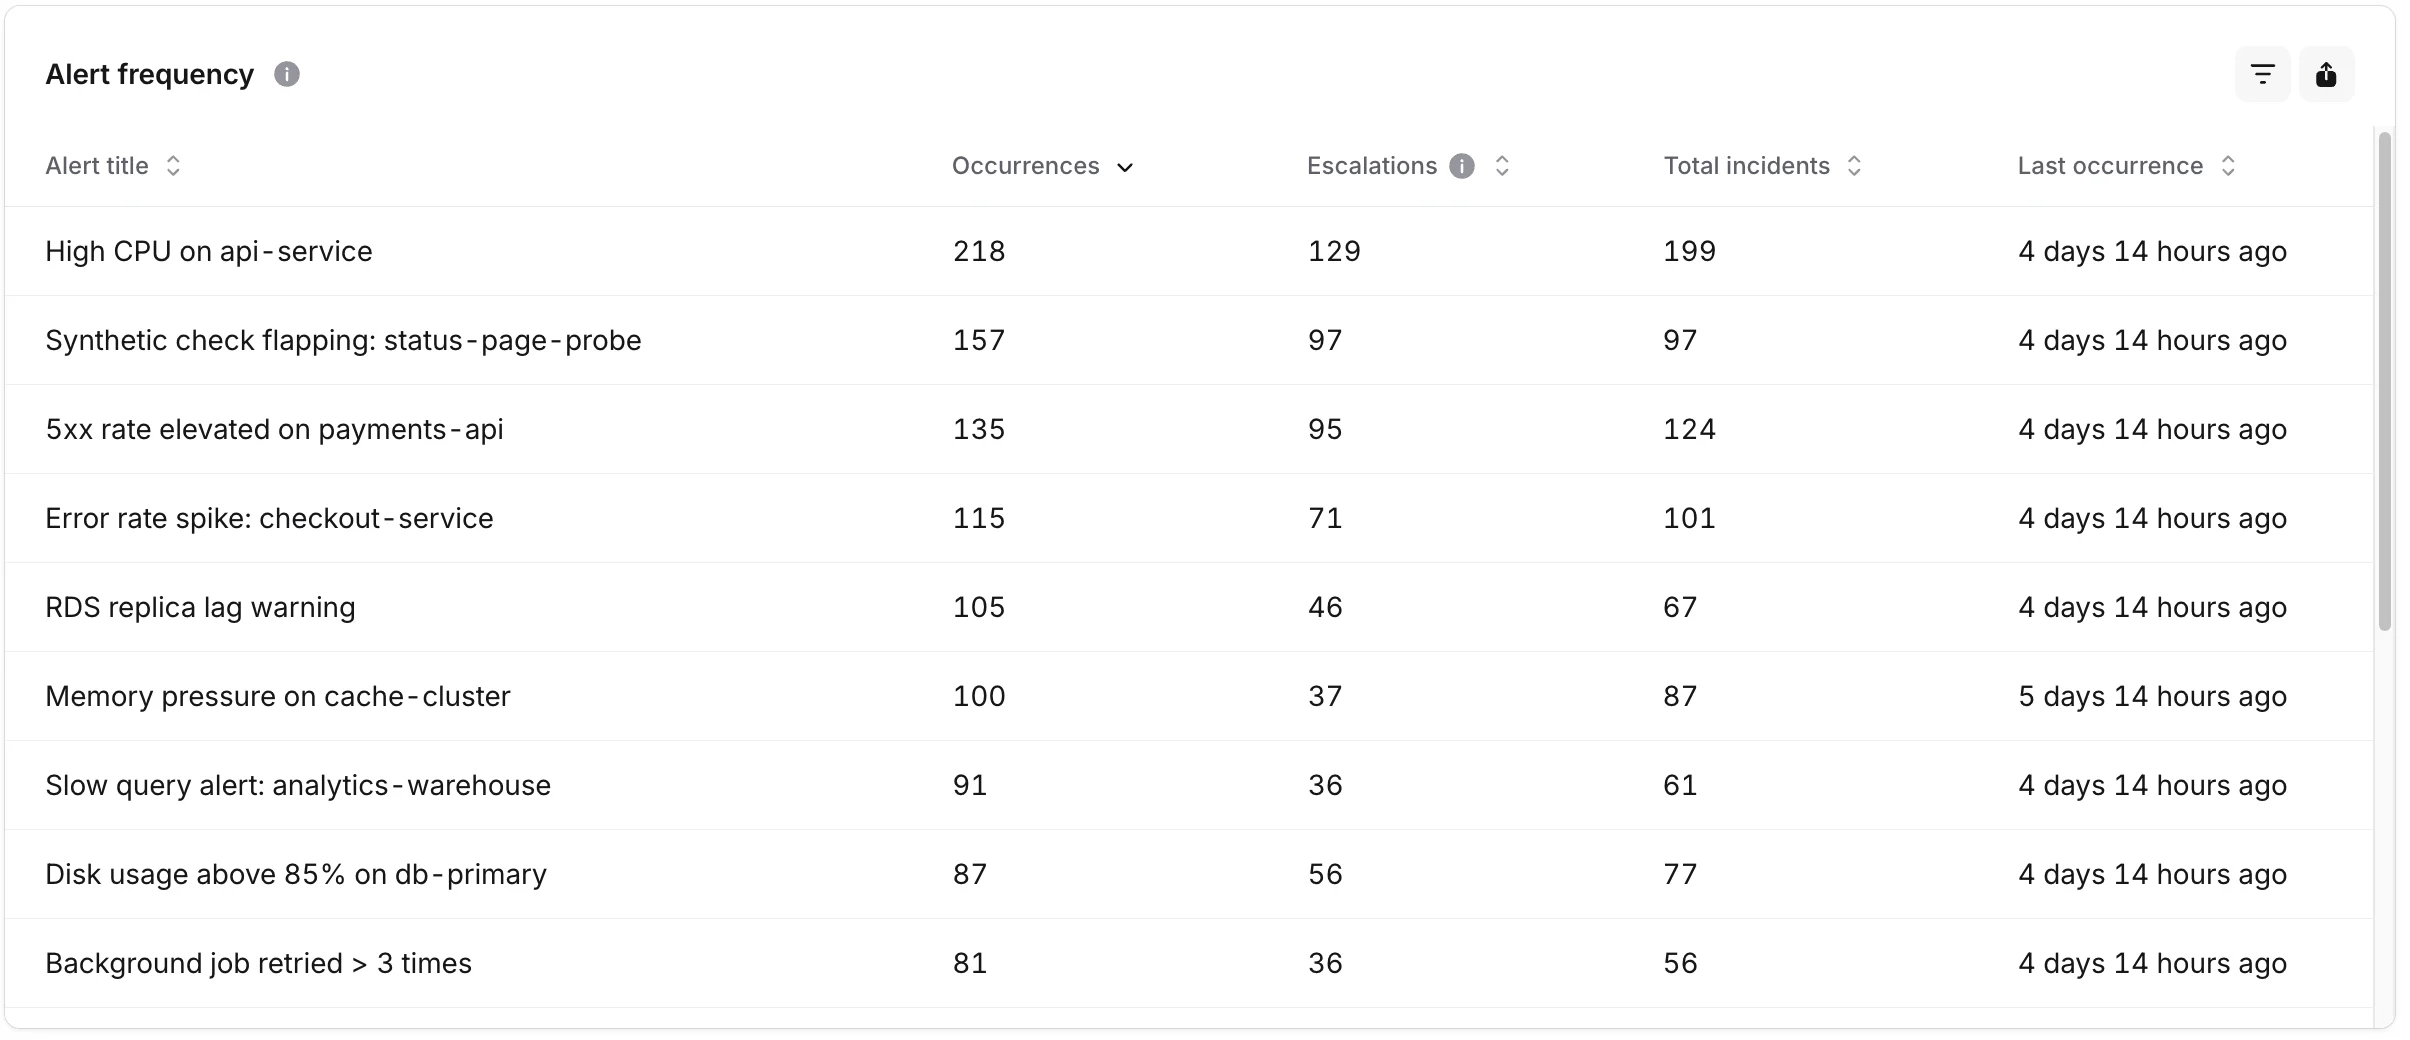 If you see a title with a lot of occurrences and escalations but no incidents created, that's usually a sign the alert is firing but consistently being declined as noise. It's a good candidate for tuning or rerouting.
## Alert acceptance
The **Alert acceptance** section answers "of the alerts that paged someone, how many were actually worth paging?"
### Declined alerts
The trend tile shows the number of alerts in the selected window that turned into incidents which were then declined, with a comparison to the previous period.
### Alert acceptance rate
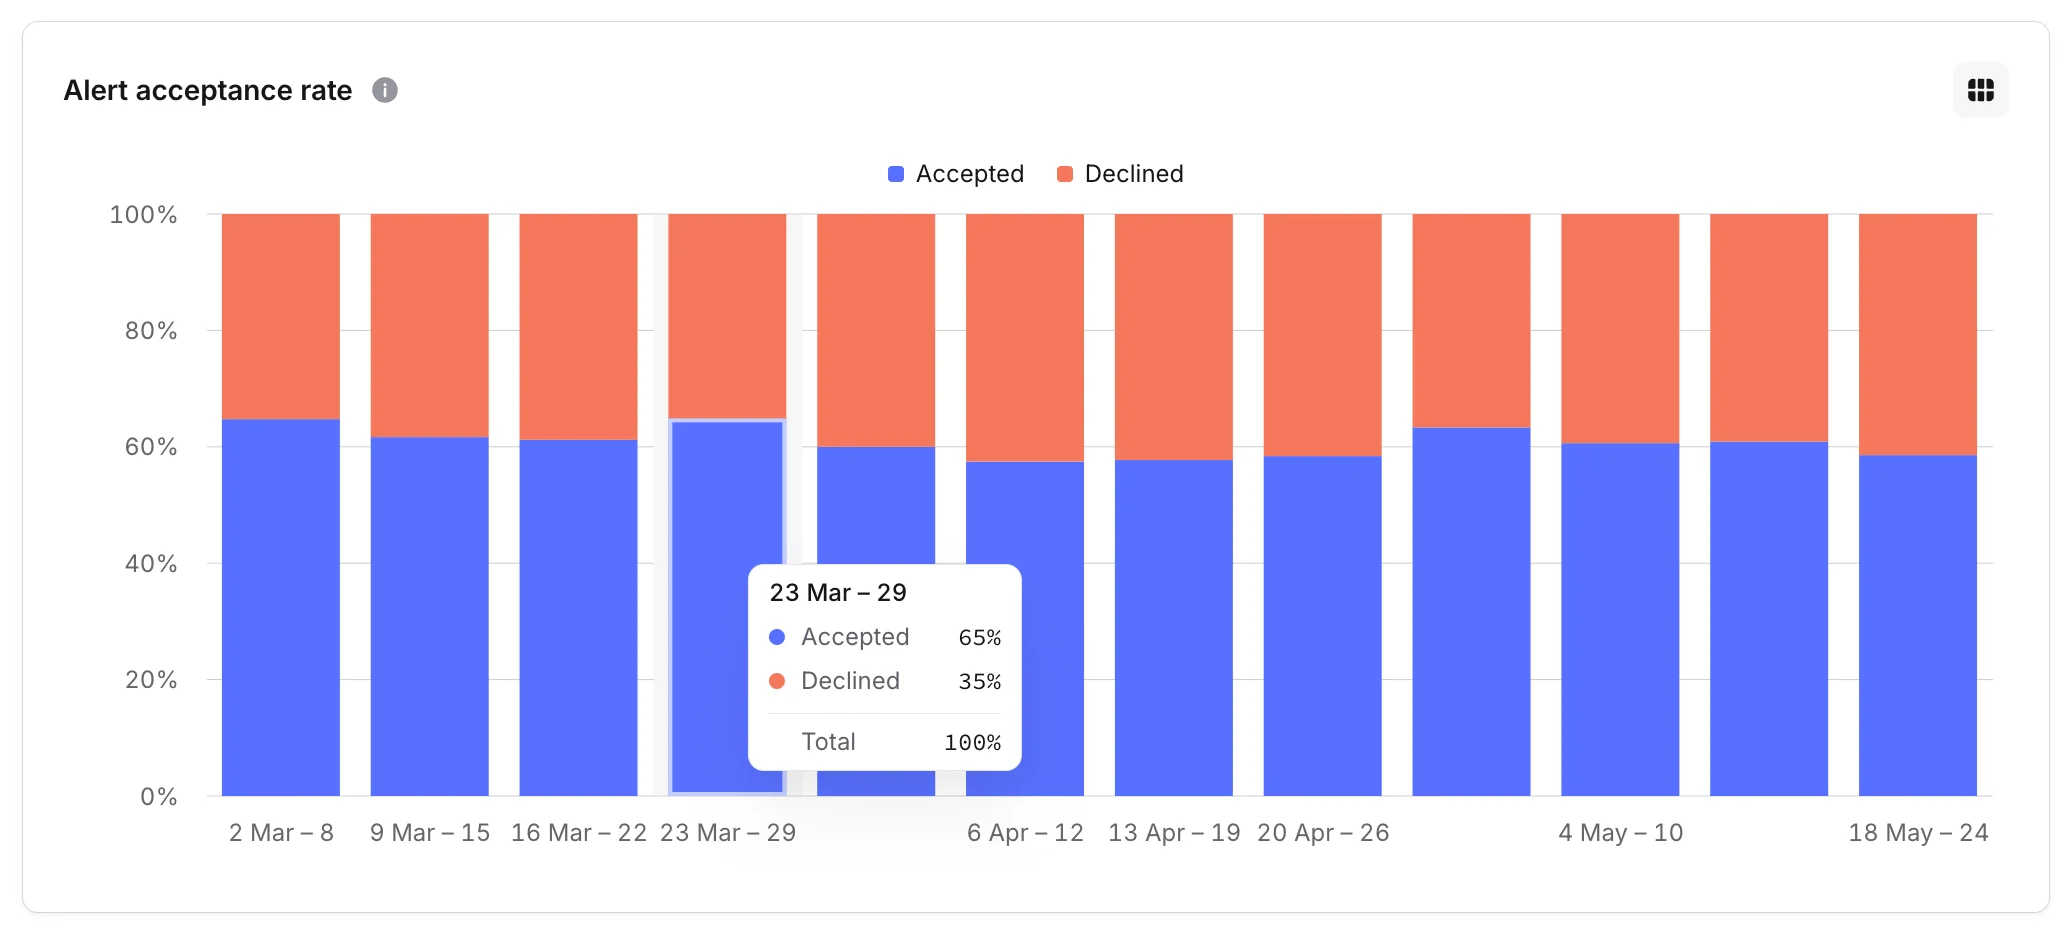
A stacked bar chart plots the share of accepted versus declined alerts over time. A rising decline rate is an early signal that pager fatigue is creeping in. Click a stack segment to open the [underlying alerts drawer](#underlying-alerts-drawer) filtered by that status.
If you see a title with a lot of occurrences and escalations but no incidents created, that's usually a sign the alert is firing but consistently being declined as noise. It's a good candidate for tuning or rerouting.
## Alert acceptance
The **Alert acceptance** section answers "of the alerts that paged someone, how many were actually worth paging?"
### Declined alerts
The trend tile shows the number of alerts in the selected window that turned into incidents which were then declined, with a comparison to the previous period.
### Alert acceptance rate
A stacked bar chart plots the share of accepted versus declined alerts over time. A rising decline rate is an early signal that pager fatigue is creeping in. Click a stack segment to open the [underlying alerts drawer](#underlying-alerts-drawer) filtered by that status.
 ### Most frequently declined alerts
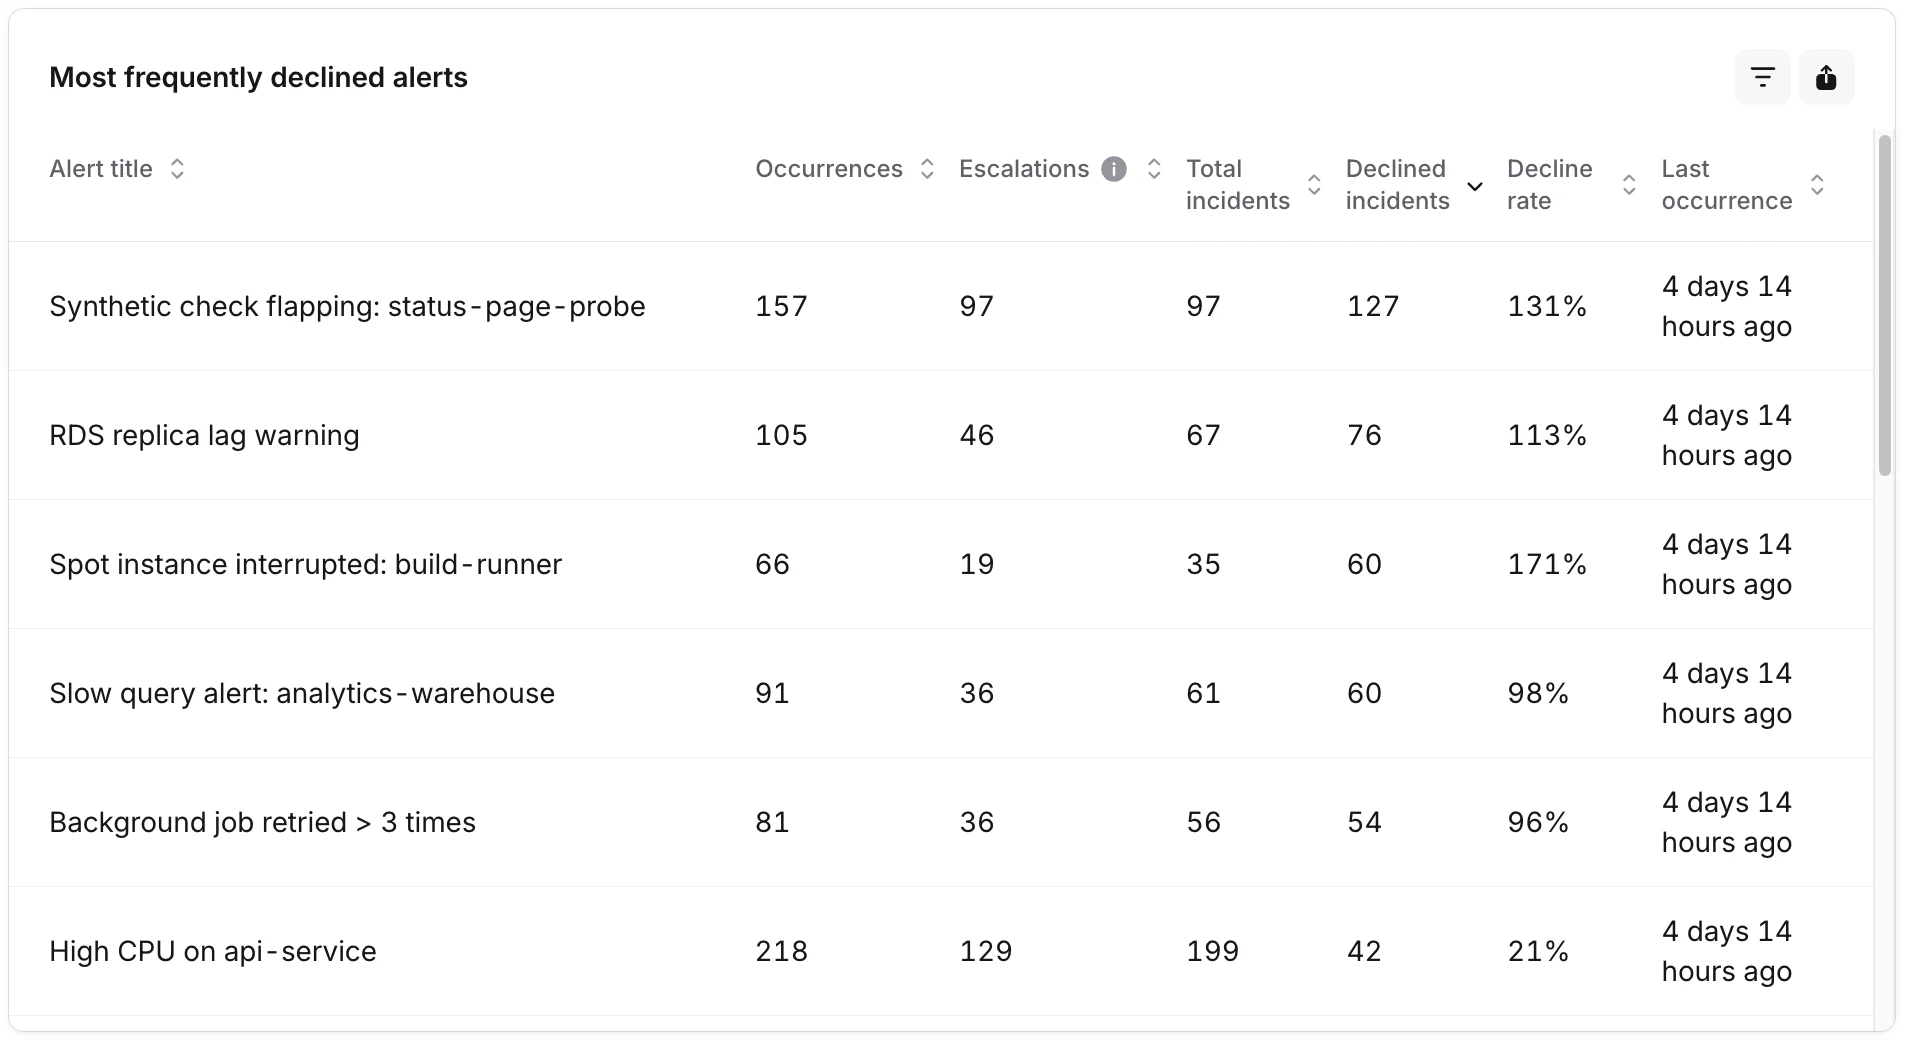
A companion to the Alert frequency table, but ranked by decline volume. The same columns as Alert frequency, plus:
* **Declined incidents**: how many of the incidents created from this alert were declined.
* **Decline rate**: declined incidents as a share of total incidents for the alert.
Click any row to inspect the underlying alerts, or export the table as a CSV. If a noisy title keeps topping this list, that's where to focus your tuning effort or [priority routing](/alerts/priority-routing) rules.
### Most frequently declined alerts
A companion to the Alert frequency table, but ranked by decline volume. The same columns as Alert frequency, plus:
* **Declined incidents**: how many of the incidents created from this alert were declined.
* **Decline rate**: declined incidents as a share of total incidents for the alert.
Click any row to inspect the underlying alerts, or export the table as a CSV. If a noisy title keeps topping this list, that's where to focus your tuning effort or [priority routing](/alerts/priority-routing) rules.
 ## Underlying alerts drawer
Click a chart bar segment, a table row, or the **Underlying data** button anywhere on the dashboard to open a side drawer listing the individual alerts that make up the figure you clicked. The drawer respects the dashboard filters and shows:
* The alert title and source.
* When it fired.
* Whether the resulting incident was accepted or declined.
Click a row to open the full alert details. The drawer also has its own CSV export covering the filtered alert list.
## FAQs
The Escalations column only counts escalations that went through [incident.io On-call](/on-call/escalation-paths). If you're paging some teams through another tool, those won't show up here.
An alert is counted as accepted if it created an incident that wasn't declined. Anything you decline (either manually or via [decision flows](/incidents/decision-flows)) lands in the Declined bucket.
Yes. The **Alerts created by** selector above the chart lets you group by alert source or any catalog-backed [alert attribute](/alerts/attributes-and-priorities), so you can break volume down by team, service, environment, or whatever else you track on alerts.
The dashboard reads from the insights warehouse, which syncs from production on a regular cadence. The sync badge at the top of the page shows when the data was last refreshed.
Yes. The date range, aggregation, comparison toggle, and filter selections are all reflected in the URL, so any view you've set up can be shared by copying the address from your browser.
## Underlying alerts drawer
Click a chart bar segment, a table row, or the **Underlying data** button anywhere on the dashboard to open a side drawer listing the individual alerts that make up the figure you clicked. The drawer respects the dashboard filters and shows:
* The alert title and source.
* When it fired.
* Whether the resulting incident was accepted or declined.
Click a row to open the full alert details. The drawer also has its own CSV export covering the filtered alert list.
## FAQs
The Escalations column only counts escalations that went through [incident.io On-call](/on-call/escalation-paths). If you're paging some teams through another tool, those won't show up here.
An alert is counted as accepted if it created an incident that wasn't declined. Anything you decline (either manually or via [decision flows](/incidents/decision-flows)) lands in the Declined bucket.
Yes. The **Alerts created by** selector above the chart lets you group by alert source or any catalog-backed [alert attribute](/alerts/attributes-and-priorities), so you can break volume down by team, service, environment, or whatever else you track on alerts.
The dashboard reads from the insights warehouse, which syncs from production on a regular cadence. The sync badge at the top of the page shows when the data was last refreshed.
Yes. The date range, aggregation, comparison toggle, and filter selections are all reflected in the URL, so any view you've set up can be shared by copying the address from your browser.